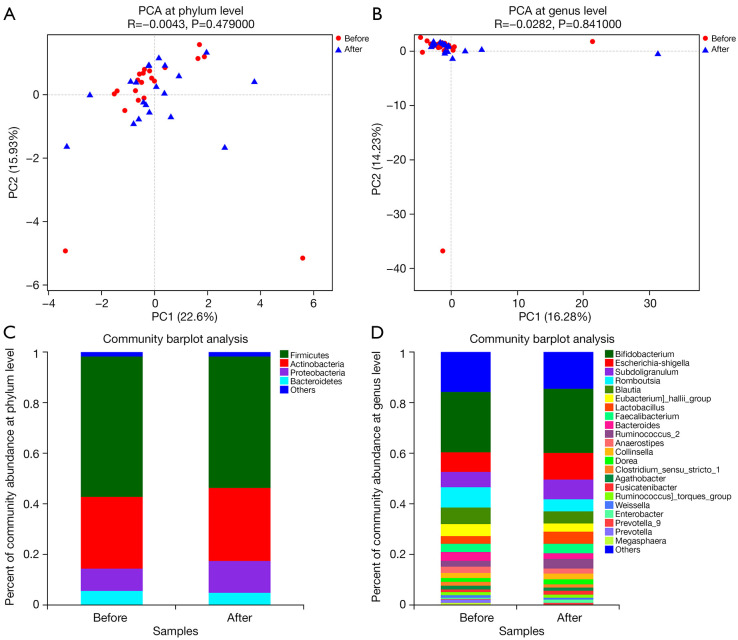
Figure 2.
Analyses of microbiome composition in pre- and post-treatment fecal samples by 16S rRNA sequencing: (A) The principal component analysis (PCA) revealed no difference in composition between the pre- and post-treatment fecal samples at the phylum level (P=0.479, ANOSIM). (B) The PCA analysis revealed no difference in composition between the pre- and post-treatment fecal samples at the genus level (P=0.841, ANOSIM). (C) The relative abundance of microbial phyla between the pre- and post-treatment samples was indistinguishable (P=0.479, ANOSIM analysis). (D) The relative abundance of microbial genera between the pre- and post-treatment samples was indistinguishable (P=0.841, ANOSIM).

