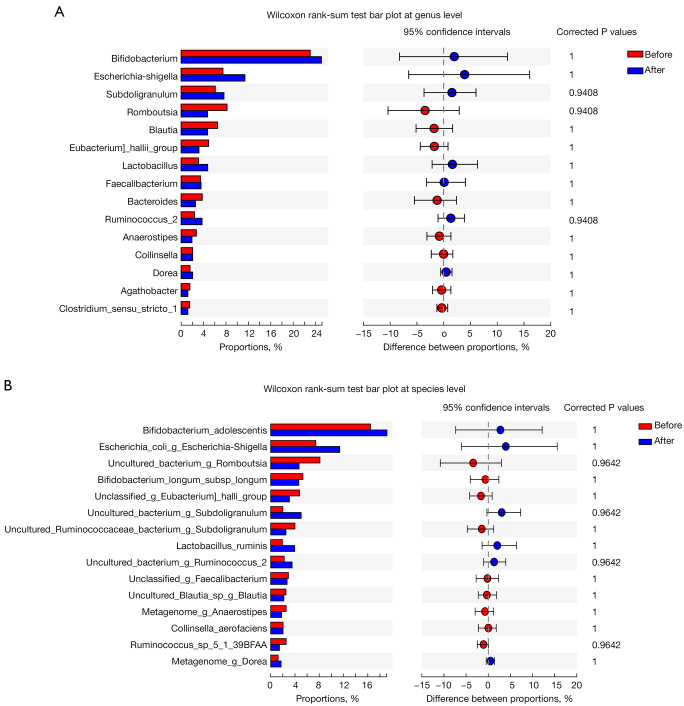
Figure 3.
Analyses of microbiome composition differences in major genera and species between the pre- and post-treatment fecal samples by the Wilcoxon rank-sum test: (A) bar plots demonstrating no significant changes in major genera abundance between the pre- and post-treatment (red and blue, respectively) fecal samples (all P>0.05, Wilcoxon rank-sum test); (B) bar plots demonstrating no significant difference in abundance of major species between the pre- and post-treatment fecal samples (all P>0.05, Wilcoxon rank-sum test).

