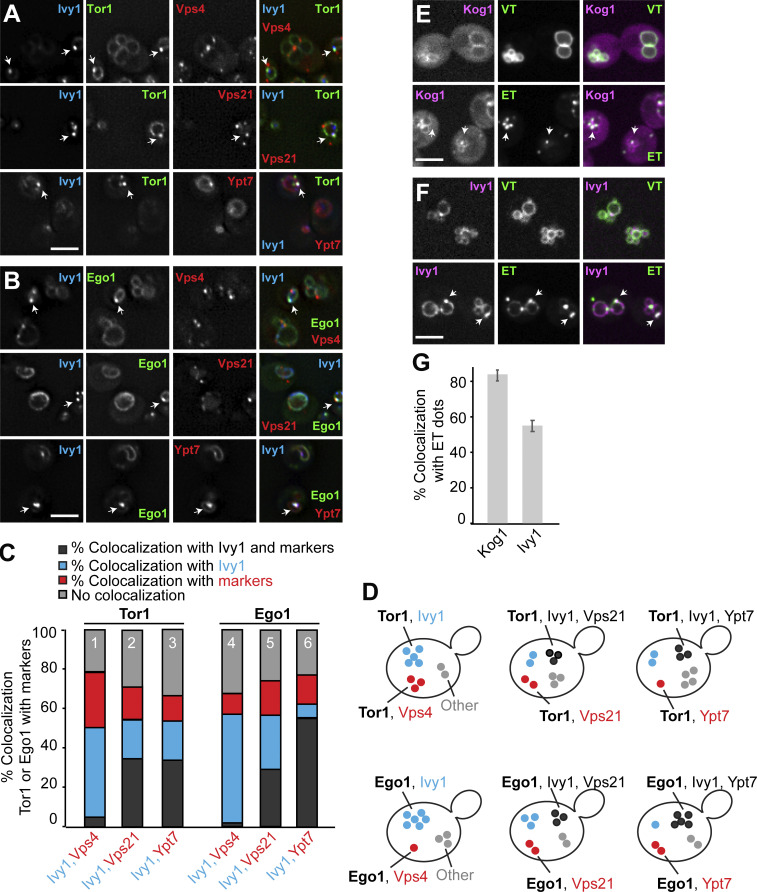
Figure 1.
Ivy1 localizes to SEs. (A and B) Localization of Tor1 or Ego1 relative to Ivy1 and Vps4, Vps21, or Ypt7. Cells expressing mGFP-tagged Tor1 or Ego1 with Halo-tagged Ivy1 and mCherry-tagged Vps4, Vps21, or Ypt7 were grown in synthetic complete medium. The cells were incubated with the Janelia fluor 646 Halo-tag ligand for 1 h and washed eight times before imaging. The cells were analyzed by fluorescence microscopy and are shown as individual slices. Scale bar, 5 µm. Arrows show colocalizing dots. (C) Quantification of Tor1 or Ego1 dots colocalizing with Ivy1 and/or Vps4, Vps21, or Ypt7 puncta (from A and B). Cells (n ≥ 150), Tor1 dots (n ≥ 100), Ego1 dots (n ≥ 100), Ivy1 dots (n ≥ 150), Vps4 dots (n ≥ 500), Vps21 dots (n ≥ 500), and Ypt7 dots (n ≥ 100) from three independent experiments were quantified by ImageJ. (D) Schematic representation showing the observed populations of fluorescent mGFP-Tor1 and Ego1-mGFP dots in cells. Dark gray dots indicate the fraction of Tor1 (top) or Ego1 (bottom) colocalizing with Ivy1 and Vps4 (left), Vps21 (middle), or Ypt7 (right) puncta. Blue spots indicate the fraction of Tor1 or Ego1 colocalizing just with Ivy1. Red dots indicate the fraction of Tor1 or Ego1 colocalizing with just Vps4 (left), just Vps21 (middle), or just Ypt7 (right). Light gray dots indicate the fraction of Tor1 or Ego1 without any colocalization with the selected markers. (E and F) Localization of Kog1 or Ivy1 relative to VT and ET reporters. Cells expressing mCherry-tagged Kog1 or mScarlet-tagged Ivy1 were transformed with ET (FYVE-GFP-Sch9C-term) or VT (Sch9C-term-GFP-Pho8N-term) reporters. The cells were grown in a synthetic medium and analyzed by fluorescence microscopy and are shown as individual slices. Scale bar, 5 µm. Arrows show colocalizing dots. (G) Quantification of the number of Kog1 or Ivy1 dots colocalizing with ET-positive dots. Cells (n ≥ 150), Kog1 dots (n ≥ 100), Ivy1 dots (n ≥ 150), and ET dots (n ≥ 200) were quantified by ImageJ. Error bars represent SD of three independent experiments.

