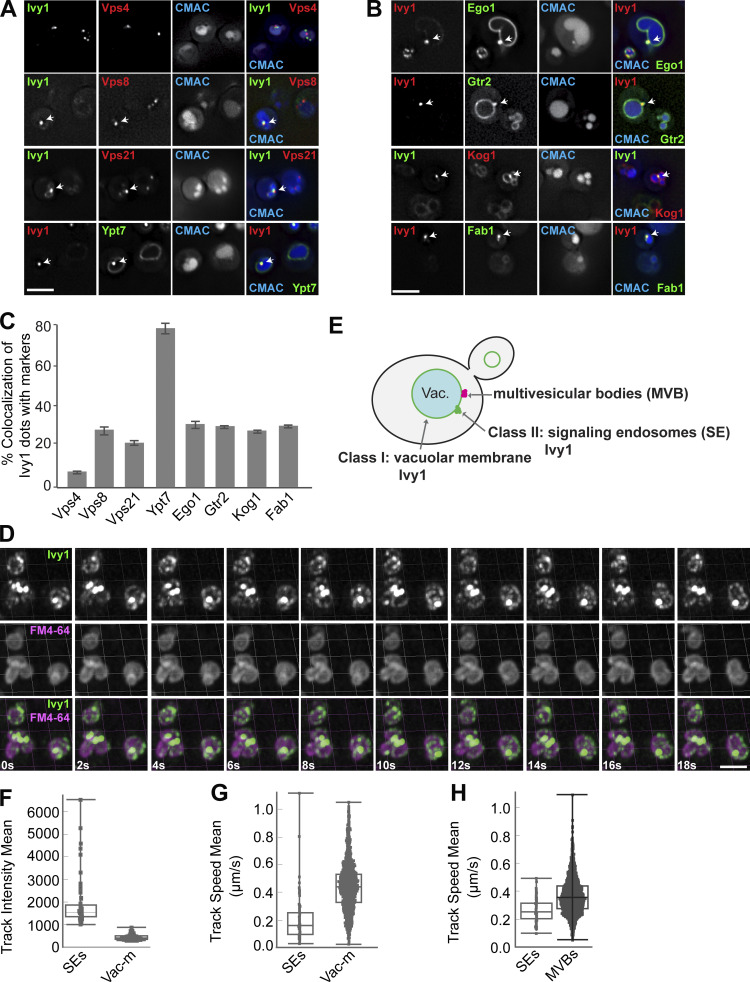
Figure 2.
Ivy1-positive structures mark SEs that are distinct from MVBs. (A and B) Localization of Ivy1-positive dots relative to endosomal proteins. Cells expressing mGFP-tagged Ivy1 and mCherry-tagged Vps4, Vps8, Vps21, and Kog1 or expressing mCherry-tagged Ivy1 and GFP-tagged Ypt7, Ego1, Gtr2, and mNeon-tagged Fab1 were grown in a synthetic medium. Vacuoles were stained with CMAC. The cells were analyzed by fluorescence microscopy, and individual slices are shown. Scale bar, 5 µm. Arrows show colocalizing dots. (C) Quantification of Ivy1 dots colocalizing with endosomal proteins. Cells (n ≥ 150), Ivy1 dots (n ≥ 150), Vps4 dots (n ≥ 300), Vps8 dots (n ≥ 50), Vps21 dots (n ≥ 200), Ypt7 dots (n ≥ 150), Ego1 dots (n ≥ 50), Gtr2 dots (n ≥ 50), Kog1 dots (n ≥ 50), or Fab1 dots (n ≥ 50) were quantified by ImageJ. Error bars represent SD of three independent experiments. (D) Ivy1 localization by LLSM after 3D deconvolution (Video 1). Cells expressing mGFP-tagged Ivy1 were grown in synthetic medium. Vacuoles were stained with FM4-64 and visualized relative to Ivy1-mGFP by Imaris. Scale bar, 5 μm. 200–500 cells were analyzed in each independent experiment. (E) Schematic model showing the location of fluorescent Ivy1-mGFP expressed in yeast cells. The green ring corresponds to Ivy1 localization on the vacuolar membrane (class I), green spots indicate SEs (class II), and magenta spots are MVBs. (F) Fluorescence intensity distribution of all tracked spots for Ivy1-mGFP from Video 1. (G) Speed distribution based on trajectory displacements per time point of all tracks for Ivy1-mGFP from Video 1. The data were analyzed as in F. (H) Speed distribution for Ivy1-mCherry (SEs) and Vps4-HA-mGFP (MVBs) from Video 2. The data were analyzed as in F.

