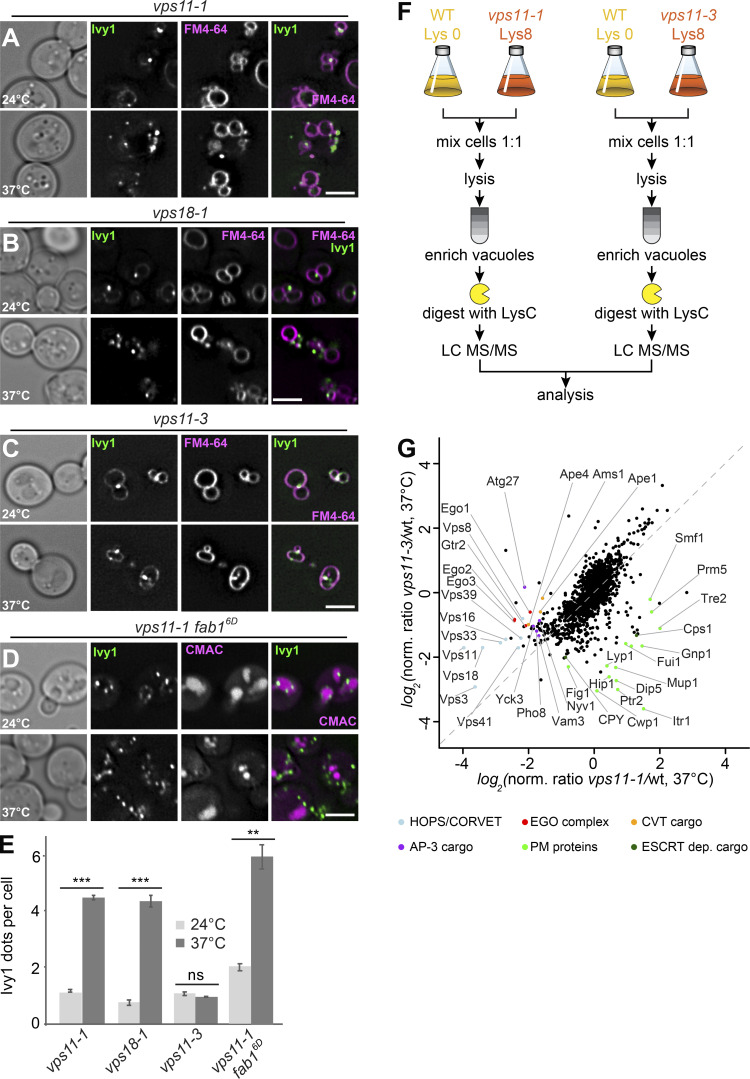
Figure 4.
Ivy1-positive structures accumulate in HOPS mutants. (A–C) Localization of Ivy1 relative to the vacuole. Selected ts strains (vps11-1, vps18-1, and vps11-3) expressing mGFP-tagged Ivy1 were grown at 24°C in a synthetic medium, and then shifted to 24 or 37°C for 1 h. Vacuoles were stained with FM4-64. The cells were analyzed by fluorescence microscopy and are shown as individual slices. Scale bar, 5 μm. (D) vps11-1 fab16D cells expressing mGFP-tagged Ivy1 were stained with CMAC and analyzed as before. (E) Quantification of Ivy1 dots per cell in the indicated mutant strains grown at 24 and 37°C. Cells (n ≥ 150) and Ivy1 dots (n ≥ 200) were analyzed. Error bars represent SD of three independent experiments. ns, P > 0.05; **, P ≤ 0.01; ***, P ≤ 0.001 (Student’s t test). (F) Design of the experimental procedure to determine vacuolar proteomics. (G) Vacuolar proteomic analysis. Wild-type (wt) and vps11-1 or vps11-3 cells were grown in light lysine (wild-type cells) or heavy lysine (mutant cells) containing SILAC medium as described in Materials and methods and incubated at 37°C for 1 h. The vacuoles were isolated and analyzed by mass spectrometry. Intensities of identified proteins are plotted in normalized heavy over light SILAC ratios. Selected vacuolar proteins are marked. CVT, cytoplasm-to-vacuole targeting; PM, plasma membrane.

