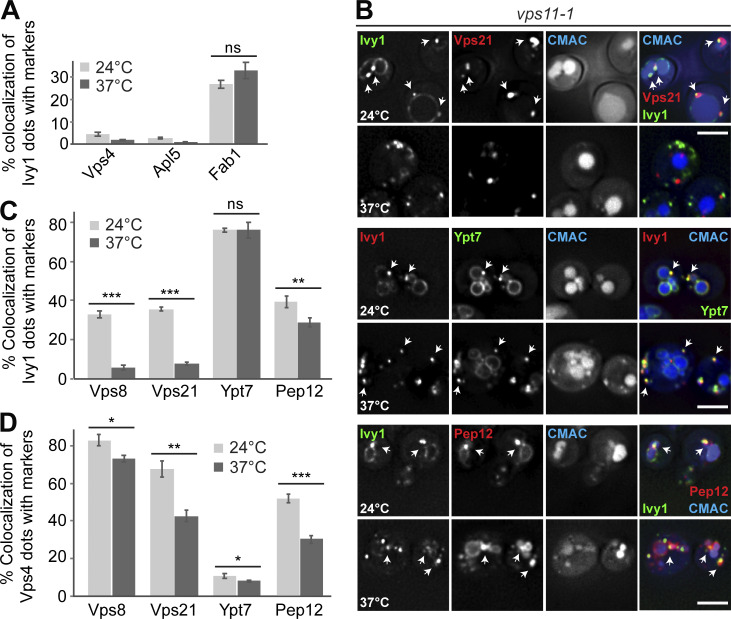
Figure 5.
Ivy1 structures lose EE marker proteins upon HOPS inactivation. (A) Quantification of Ivy1 dots colocalizing with Vps4, Apl5, or Fab1 puncta in vps11-1 mutant cells grown at 24 or 37°C (related to Fig. S2 A). Cells (n ≥ 150), Ivy1 dots (n ≥ 200), Vps4 dots (n ≥ 400), Apl5 dots (n ≥ 500), or Fab1 dots (n ≥ 50) were quantified by ImageJ. Error bars represent SD of three independent experiments. ns, P > 0.05 (Student’s t test). (B) Localization of Ivy1 relative to the endosomal Rabs Vps21 and Ypt7 or the SNARE Pep12. vps11-1 ts cells expressing mGFP-tagged Ivy1 and mCherry-tagged Vps21, Pep12 or expressing mScarlet-tagged Ivy1 and mGFP-tagged Ypt7 were grown at 24°C in a synthetic medium, and then shifted to 24 or 37°C for 1 h. Vacuoles were stained with CMAC. The cells were analyzed by fluorescence microscopy, and individual slices are shown. Scale bar, 5 µm. Arrows show colocalizing dots. (C) Quantification of Ivy1 dots that colocalize with Vps8, Vps21, Ypt7, or Pep12 puncta (related to Fig. S2 A). Cells (n ≥ 150), Ivy1 dots (n ≥ 150), Vps8 dots (n ≥ 100), Vps21 dots (n ≥ 300), Ypt7 dots (n ≥ 100), or Pep12 dots (n ≥ 150) were quantified by ImageJ. Error bars represent SD of three independent experiments. ns, P > 0.05; **, P ≤ 0.01; ***, P ≤ 0.001 (Student’s t test). (D) Quantification of Vps4 dots that colocalize with Vps8, Vps21, Ypt7, or Pep12 puncta (related to Fig. S3 A). Cells (n ≥ 150) and dots of Vps4 (n ≥ 400), Vps8 (n ≥ 100), Vps21 (n ≥ 300), Ypt7 (n ≥ 100), or Pep12 (n ≥ 150) were quantified by ImageJ. Error bars represent SD of three independent experiments. *, P ≤ 0.05; **, P ≤ 0.01; ***, P ≤ 0.001 (Student’s t test).

