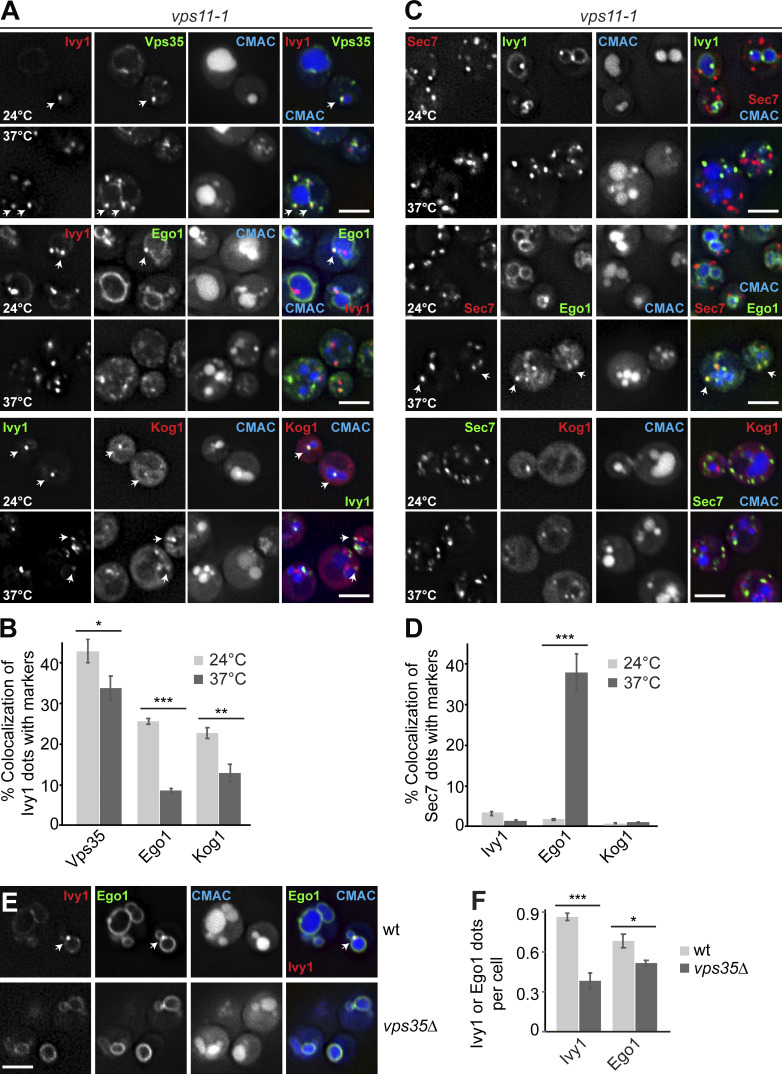
Figure 6.
HOPS and retromer mutants differentially affect Ego1 localization away from SEs. (A) Ivy1 structures lose signaling complexes upon HOPS inactivation. vps11-1 cells expressing mScarlet-tagged Ivy1 and mGFP-tagged Vps35 or Ego1 or expressing mGFP-tagged Ivy1 and mCherry-tagged Kog1 were grown at 24°C in a synthetic medium and then shifted to 24 or 37°C for 1 h. Vacuoles were stained with CMAC. The cells were analyzed by fluorescence microscopy, and individual slices are shown. Arrows show colocalizing dots. (B) Quantification of Ivy1 dots colocalizing with Vps35, Ego1, or Kog1 puncta. Cells (n ≥ 200), Ivy1 dots (n ≥ 200), Vps35 dots (n ≥ 150), Ego1 dots (n ≥ 150), or Kog1 dots (n ≥ 100) were quantified by ImageJ. Error bars represent SD of three independent experiments. *, P ≤ 0.05; **, P ≤ 0.01; ***, P ≤ 0.001 (Student’s t test). (C) Localization of Sec7 relative to Ivy1, Ego1, or Kog1. vps11-1 cells expressing mScarlet-tagged Sec7 and mGFP-tagged Ivy1, Ego1, or mGFP-tagged Sec7 and mCherry-tagged Kog1 were grown and analyzed as in A. Arrows show colocalizing dots. (D) Percentage of Sec7 dots colocalizing with Ivy1, Ego1, or Kog1 puncta. Cells (n ≥ 200) and Ivy1 (n ≥ 200), Sec7 (n ≥ 350), Ego1 (n ≥ 150), or Kog1 (n ≥ 100) dots were quantified by ImageJ. Error bars represent SD of three independent experiments. ***, P ≤ 0.001 (Student’s t test). (E) Localization of Ivy1 relative to Ego1 in wild-type (wt) and retromer mutant. Wild-type or vps35∆ mutant expressing mCherry-tagged Ivy1 and mGFP-tagged Ego1 were grown in a synthetic medium. Vacuoles were stained with CMAC. The cells were analyzed by fluorescence microscopy, and individual slices are shown. Scale bar, 5 µm. Arrows show colocalizing dots. (F) Quantification of Ivy1 and Ego1 dots per wild-type or vps35Δ cell. Cells (n ≥ 200), Ivy1 dots (n ≥ 200), and Ego1 dots (n ≥ 200) were quantified. Error bars represent SD of three independent experiments. *, P ≤ 0.05; ***, P ≤ 0.001 (Student’s t test).

