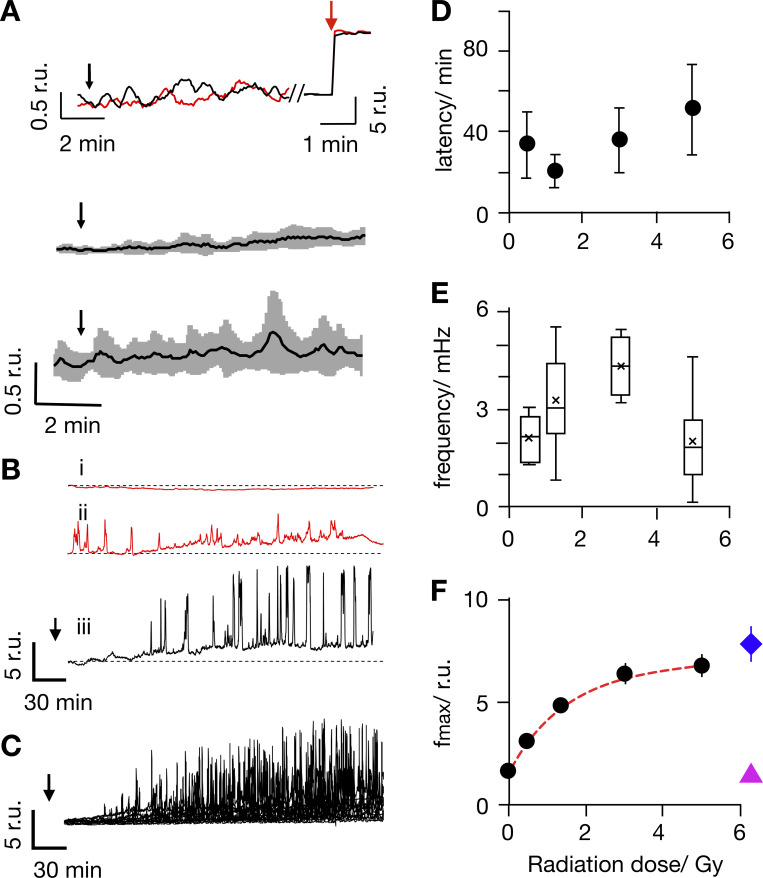
Figure 1.
Ionizing irradiation elicits delayed Ca2+cyt oscillations with distinct frequencies and amplitudes. (A) Representative Fluo-4 signals report constant Ca2+cyt in individual Jurkat cells (top). Fluorescence was recorded in real time before, during, and after irradiation with 1 Gy (red) and 10 Gy (black) x rays at times indicated by black arrows. The same cells responded with a maximal fluorescence increase after addition of 1 µM ionomycin (red arrow). Mean Fluo-4 intensity from cells irradiated at arrow with 1 Gy (middle) or 10 Gy (bottom) x rays. Data are means (black) ± SD (gray) from experiments as in A, with 15 cells for each dose. (B) Representative long-term measurements of Fluo-4 intensity in Jurkat cells, of which two were not irradiated (i, ii, ctrl., red) and the other was exposed to 5 Gy x ray (iii, black). Time of x-ray exposure is indicated by black arrows. While unirradiated control cells maintain a stable Fluo-4 signal (i) or reveal irregular oscillations (ii), the irradiated cell starts to oscillate after a lag time (iii). (C) Overlay of Fluo-4 signal from 15 individual cells after irradiation with 5 Gy; time of x-ray exposure is indicated by black arrow. (D–F) Latency time between onset of Ca2+cyt oscillations after irradiation, oscillation frequency (E), and maximal amplitude of oscillation (F) as a function of irradiation dose. The colored symbols show different levels of Fluo-4 fluorescence intensity: Fluo-4 intensity elicited by 5 Gy in Ca2+ free external buffer including 5 mM EGTA (magenta triangle) and maximal Fluo-4 intensity after adding 1 µM ionomycin (blue diamond). Data are mean values ± SD from ≥25 cells per dose; box plot indicates 25th and 75th percentiles of data; and whiskers indicate 5% and 95% limits. All Ca2+cyt measurements in response to x-ray irradiation were performed in buffer containing 2 mM Ca2+.

