Figure 2.
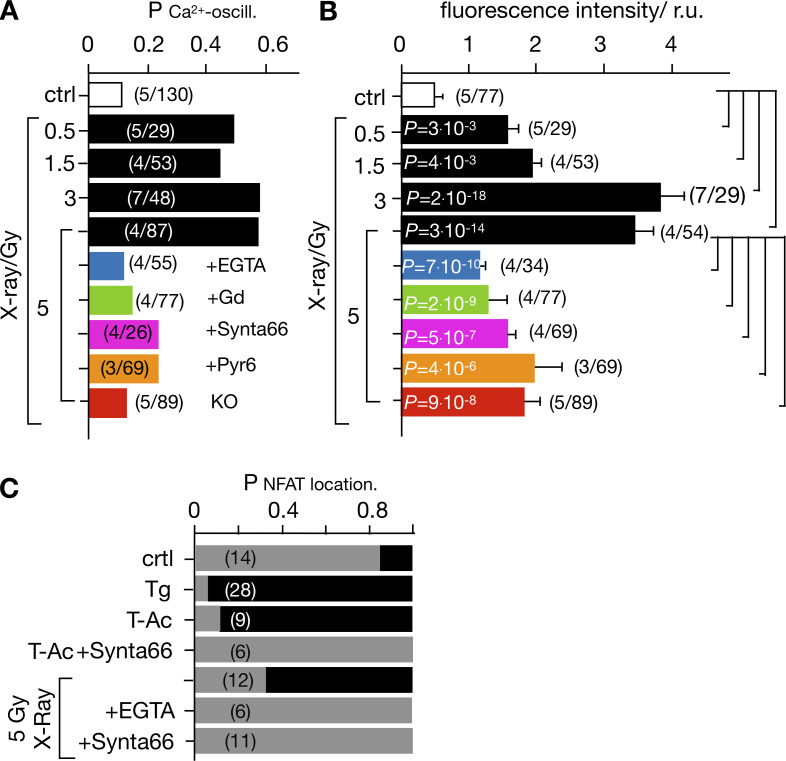
Radiation-induced Ca2+cyt oscillations and nuclear NFAT translocation are triggered by x rays and abolished after inhibition of Ca2+ influx. The probability for detecting Ca2+cyt oscillations (PCa2+-oscill.) in Jurkat cells as in Fig. 1 Biii. A population of cells was imaged under the aspect of finding ≥10 min after start of imaging Ca2+cyt oscillations defined as ≥5 repetitive Ca2+cyt spikes. Cells were either not irradiated (ctrl, open bar) or exposed to x-ray doses of 0.5–5 Gy in the absence (black bars) or presence of 5 mM EGTA (blue bar), 5 μM Gd3+ (green bar), 10/5 µM CRAC channel inhibitor Synta66 (magenta), or Pyr6 (orange). The same experiments were also performed with cells in which Orai1 was knocked out (KO; red bar). (B) Mean fluorescence (± SD) collected over a time window of 60–120 min after start of imaging from cells treated as in A. (C) Probability of detecting NFAT in cytosol (gray bar) or in nucleus (black bar) as in Fig. 6 A in untreated/nonirradiated control cells (crtl) and cells treated with 2 µM Tg or with 25 μl/ml ImmunoCult Human CD3/CD28/CD2 T-Ac without and with 10 µM Synta66. Other cells were exposed to 5 Gy x rays without or with 5 mM EGTA or 10 µM Synta66. Numbers in brackets in A–C give number of experiments (N)/total number of cells analyzed (n). Statistical differences between treatments in B analyzed by unpaired Student’s t test, with respective P values given in the figure.

