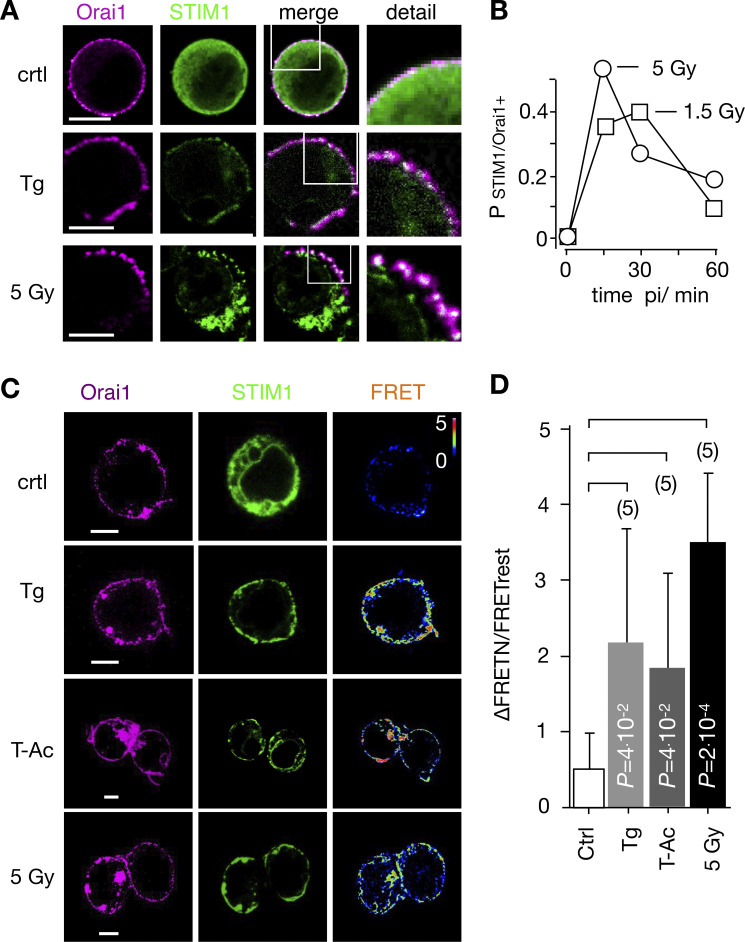
Figure 3.
IR triggers Ca2+ regulated STIM1/Orai1 CRAC channel formation. (A) Distribution of endogenous Orai1 (magenta, first column) and STIM1 (green, second column) in Jurkat cells immune-stained with Alx647 and Alx488, respectively. Overlays of green and magenta images with magnification of indicated areas are shown in third and fourth columns. Fixed cells were obtained from untreated/nonirradiated control cells (top row), cells treated for 15 min with 2 µM Tg (central row), or cells 15 min after 5-Gy x-ray exposure (bottom row). (B) Probability of finding, in a population of Jurkat cells, positive clustering of STIM1/Orai1 (PSTIM1/Orai1+) after irradiation with 1.5 Gy (squares) or 5 Gy (circles). Criteria for cluster detection are specified in Materials and methods. For each condition, ≥282 cells were analyzed. (C) Representative confocal images of same cells with fluorescent donor molecule Orai1::eCFP (magenta, first column), acceptor molecule STIM1::eYFP (green, second column), and heatmaps of the resulting FRET signals (third column) 15 min after treatment. Images are from untreated cells (control), cells incubated with 2 µM Tg, 25 μl/ml ImmunoCult Human CD3/CD28/CD2 T-Ac, or irradiated with 5 Gy. All three treatments generate a visible FRET-signal in the PM. Scale bars, 10 μm. (D) Mean FRET signal (±SD, n ≥ 5) from PM of cells as in C: untreated/nonirradiated control cells (crtl), cells 5 min in 2 μM Tg, 15 min in 25 μl/ml T-Ac, or 20 min after irradiation with 5 Gy. Statistical differences between treatments were analyzed by unpaired Student’s t test, and respective P values are given in the figure.

