Figure 4.
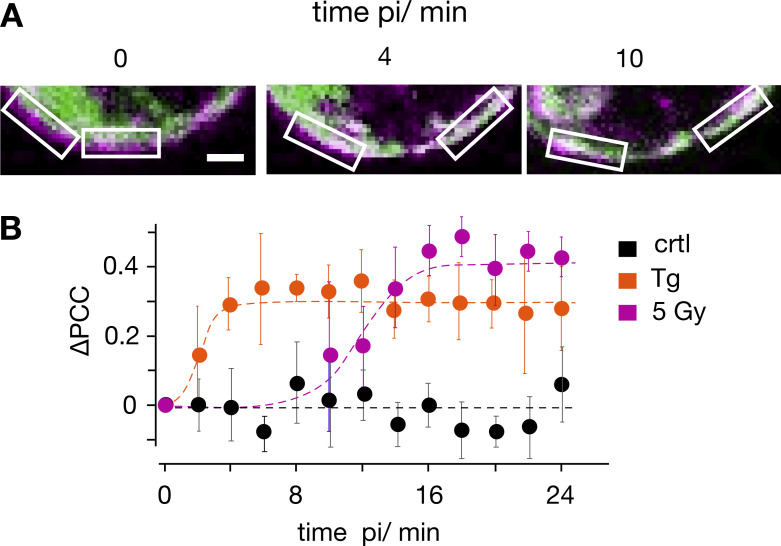
Time course of stimulus-induced STIM1/Orai1 colocalization. (A) Fluorescent images of a representative Jurkat cell cotransfected with STIM1::eYFP (green) and Orai1::eCFP (magenta) with focus on PM/cytosol interface. Images were taken before (0 min) and 4 and 10 min after treating cells with 10 μM Tg. White boxes show ROIs in membrane/cytosol interface for calculating PCC value of the two fluorescent markers. (B) Change in PCC (∆PCC) for colocalization of STIM1::eYFP and Orai1::eCFP. Data obtained from confocal live-cell real-time acquisition of Jurkat cells as in A, heterologously expressing the two proteins. In five independent experiments a mean PCC of 3.8 ± 0.08 was estimated from 18 untreated control cells (triangle). Changes in PCC values over time from untreated and treated cells (circles) are shown as deviation from this control value (∆PCC). The PCC values of untreated cells remain at the same level (ctrl, black) but increase with different kinetics in cells stimulated with 2 µM Tg (orange) or 5 Gy x rays (5 Gy, magenta). The data were fitted with logistic equation (Eq. 2, solid lines) yielding the following times for half-maximal increase in STIM1/Orai1 colocalization: 2 min for Tg and 12 min for x ray. Data for the three conditions are mean values ± SD from N ≥ 4 independent experiments with n ≥ 4 cells each. Scale bars, 2.5 μm.

