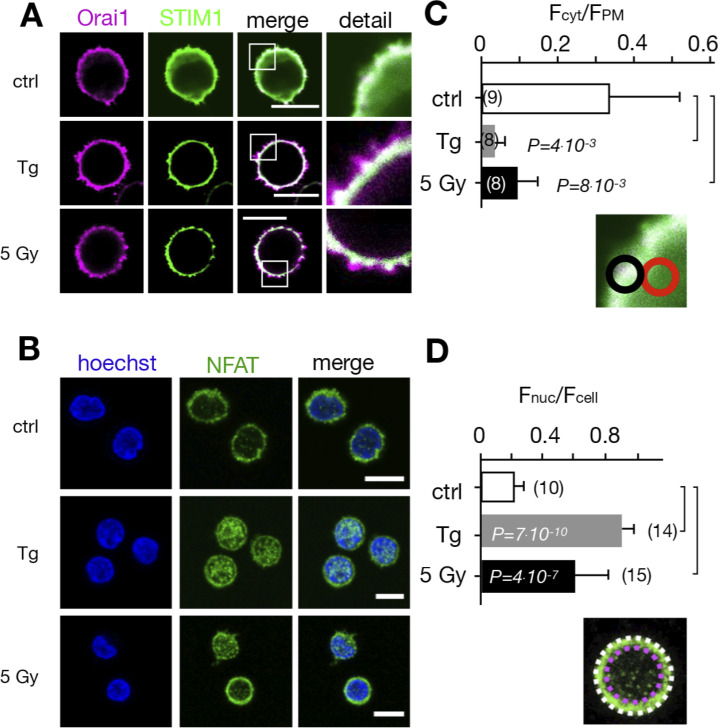
Figure 5.
Calcium-dependent SOCE/NFAT pathway is activated by IR in naive T-lymphocytes. (A) Distribution of endogenous Orai1 (magenta, first column) and STIM1 (green, second column) in fixed PBMCs immunostained with secondary antibodies Alx488 and Alx647, respectively. A merge of the two channels is shown in the third column, with higher magnification of marked areas in the fourth column. The merge of untreated control cells additionally shows the nucleus stained with Hoechst DNA dye (blue). Images show cells that were fixed as untreated/nonirradiated control cells (ctrl, top row) and cells fixed 15 min after treatment with 2 µM Tg (second row) or after exposing cells to 5 Gy (third row). (B) Mean ratio (± SD, number of cells in brackets) of green fluorescence in ROI (inset image, red circle) in cytosol divided by fluorescence in ROI in direct vicinity over PM (black circle). Data from untreated control cells (ctrl) as well as cells exposed to 2 μM Tg or 5 Gy x rays 60 min after treatment. (C) Confocal images of PBMCs showing nucleus stained with Hoechst DNA dye (blue, first column) and endogenous NFATc2 (green, second column) stained with Alx488. Overlay of both columns is shown in third column. Cells were fixed immediately (untreated/nonirradiated control, top row), 15 min after 2 µM Tg Ca2+ store depletion (second row) or 60 min after x-ray exposure with 5 Gy (third/fourth row). All scale bars, 10 μm. (D) Mean ratio (± SD, number of cells in brackets) of GFP fluorescence in nucleus (inset image, magenta circle) divided by fluorescence of total cell (white circle). Statistical differences between treatments in B and D were analyzed by unpaired Student’s t test, and respective P values are given in the figure. Source data are available for this figure: SourceData F5.

