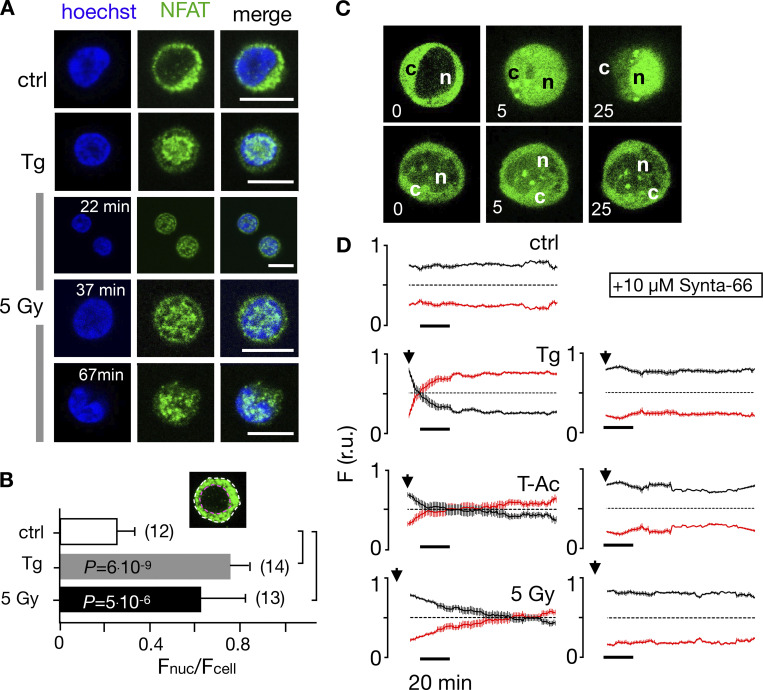
Figure 7.
Nuclear translocation of Ca2+-dependent NFAT in Jurkat cells. (A) Confocal images of Jurkat cells in which nucleus was stained with Hoechst DNA dye (blue, first column) and endogenous NFATc2 immunostained with secondary antibody Alx488 (green, second column). The third column shows a merge of blue and green channels. Cells were fixed immediately in untreated/nonirradiated control cells (ctrl, first row), 15 min after 2 µM Tg Ca2+ store depletion (Tg, second row), or 15, 30, and 60 min after x-ray exposure with 5 Gy (three bottom rows). (B) Mean ratio (± SD, number of cells in brackets) of GFP fluorescence in nucleus (inset, magenta circle) divided by fluorescence of total cell (white circle). Statistical differences between treatments were analyzed by unpaired Student’s t test, and respective P values are given in the figure. (C) Live-cell imaging of nuclear import of transiently expressed NFATc2-GFP from cytosol (c) to nucleus (n) in Jurkat cells after stimulation with 2 μM Tg in absence (top) or presence (bottom) of 10 µM CRAC channel inhibitor Synta66. Numbers indicate time in minutes after treatment. (D) Kinetic analysis of NFATc2-GFP nuclear translocation from cytosol (black) to nucleus (red). Data are from confocal imaging of Jurkat cells in untreated control condition (crtl), with 2 µM Tg in 25 μl/ml activator (T-Ac), or after 5 Gy x-ray exposure (5 Gy). Data were obtained without (left) and with (right) 10 µM Synta66. Each time course diagram is the mean ± SE of ≥12 individually measured cells. Addition of Tg and T-Ac as well as time of x-ray irradiation are indicated by arrows in D. Relative fluorescence values for NFAT in cytosol (black) and nucleus are (red) were normalized to 1. Source data are available for this figure: SourceData F7.

