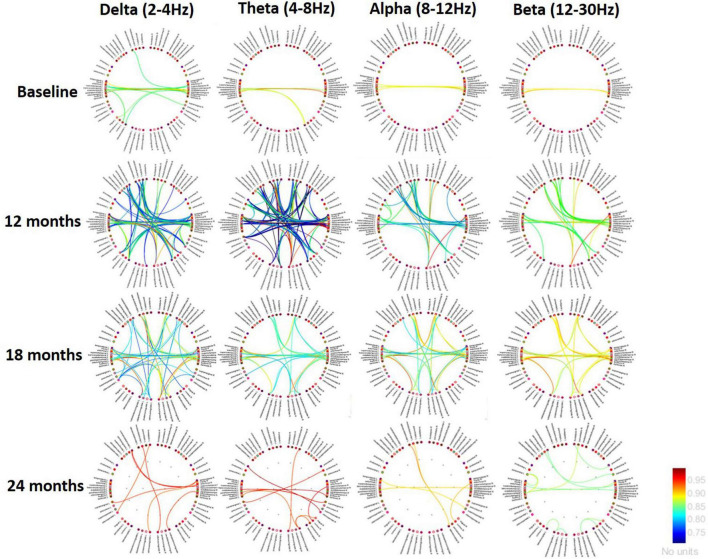
FIGURE 3.
Changes in brain connectivity from the initial study to the end of follow-up (24 months). Red and yellow lines indicate an increase in connectivity, while the blue lines show a decreasing pattern. Functional connections predominate in the bilateral mid-temporal regions with cingulate areas and, to a lesser extent, with frontomedial and orbitofrontal areas. In other words, the connectivity between the temporal and limbic areas remains quite strong. Low frequencies show an earlier decrease in connectivity, but the latest studies would indicate a pattern of reorganisation of activity.

