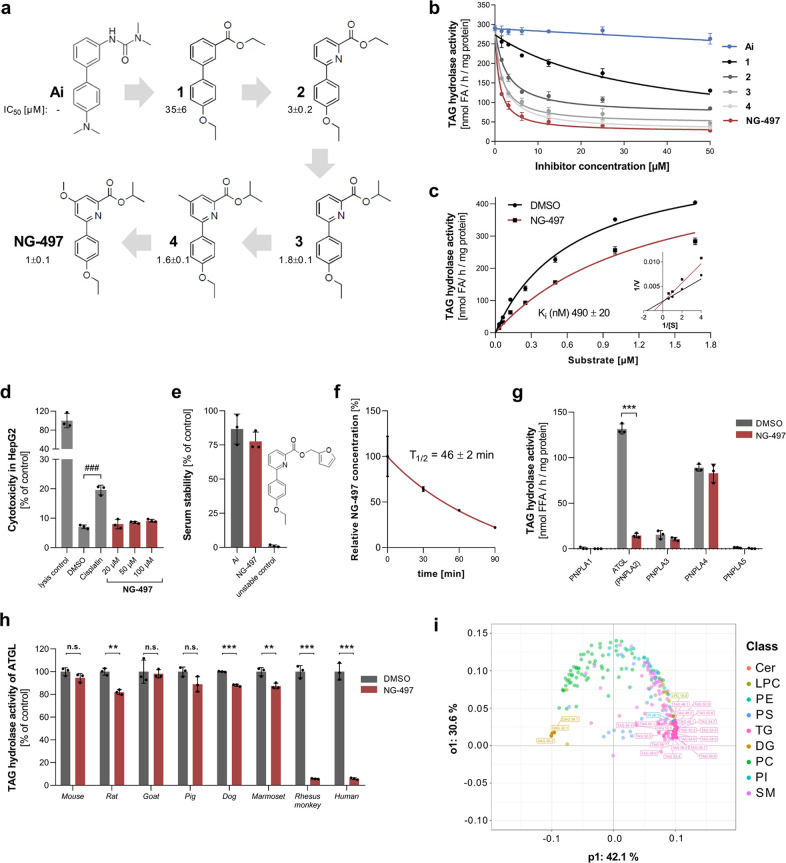
Figure 2.
Development and characterization of the human ATGL inhibitor NG-497. (a) Structure and IC50 values of human ATGL inhibitors. (b) Dose-dependent inhibition of human ATGL by respective inhibitors. (c) ATGL activity was determined at the indicated substrate concentrations in the absence and presence of NG-497 (0.5 μM). Ki was determined by nonlinear regression analysis using GraphPad Prism. Lineweaver–Burk analysis of ATGL inhibition is shown in the inset. (d) Toxicity of NG-497 in HepG2 cells was determined after 24 h incubation at indicated concentrations. Cisplatin and DMSO were used as positive and negative controls, respectively. Cytotoxicity was determined using the Roche LDH Kit and calculated as relative LDH release compared to fully lysed cells. (e) Stability of NG-497 was analyzed via ultrahigh-performance liquid chromatography–mass spectrometry (UHPLC-MS) after incubation in human serum for 0 or 3 h at 37 °C. Atglistatin and a chemically related unstable compound were used as controls. Data are presented as % decrease of initial inhibitor concentrations. (f) Stability of NG-497 exposed to HepG2 cells. Cells were treated for 1 h with 40 μM NG-497. Subsequently, the inhibitor was removed and cells were incubated in Dulbecco’s modified Eagle’s medium (DMEM) 10% FCS. NG-497 concentrations/well were determined at the indicated time points using UHPLC-MS. (g) TAG hydrolase activity of PNPLA1–5 in the absence and presence of NG-497 (100μM). (h) Inhibition of ATGL orthologs from different species by NG-497 (50 μM). Data are presented as mean ± SD. Statistical significance was determined via t test (*p < 0.05; **p < 0.01; ***p < 0.001) or ANOVA followed by Bonferroni post hoc test (###p < 0.001). (i) Lipidomic changes in NG-497-treated HepG2 cells. The cells were incubated with 40 μM inhibitor or DMSO as control for 3 h (n = 5). Subsequently, lipids were extracted and subjected to lipidomic analysis using UHPLC-MS. The detected 297 lipid species of both groups were analyzed with supervised multivariate analysis OPLS-DA and are shown as a loading plot. Lipids are colored by class, and the top 25 contributing lipid species are highlighted.

