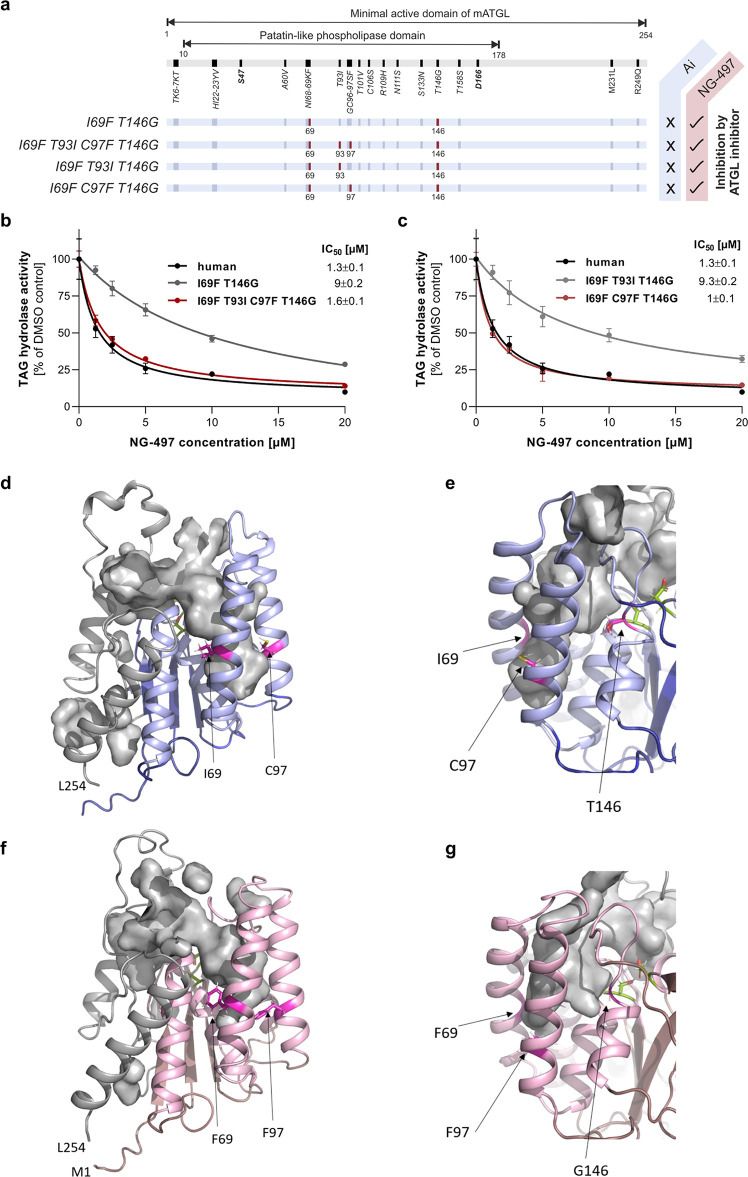
Figure 6.
Identification of the molecular scaffold determining species selectivity. (a) Schematic view of mouse ATGL variants, which are sensitive to NG-497 inhibition. Humanized aa are indicated in red and nonidentical aa are indicated in dark blue. (b) Dose-dependent inhibition of the I69F/T146G double mutant, the I69F/T93I/C97F/T146G quadruple mutant, and human ATGL. (c) Dose-dependent inhibition of triple mutants I69F/T93I/T146G and I69F/C97F/T146G, and human ATGL. IC50 values are shown in the insets. Data are presented as relative inhibition of respective DMSO controls and are indicated as mean ± SD of triplicate determinations. The expression of all ATGL variants was confirmed by Western blotting analysis (Figure S6). (d) 3D homology model of mouse ATGL residues M1–L254 depicted as a cartoon. Residues 1–178 are in blue, residues 179–254 are in gray, and S47 and D166 are represented as green sticks. I69, T93, and T146 are shown as magenta sticks and the cavity is shown as gray surface. The deeper right branch of the cavity is confined by I69 and C97 and (e) by T146 on the back side as shown in a close-up view. (f) 3D homology model of human ATGL residues M1–L254 depicted as a cartoon. Residues 1–178 are in pink, residues 179–254 are in gray, and S47 and D166 are represented as green sticks. F69, F97, and T146 are shown as magenta sticks, and the cavity is shown as a gray surface. (g) Close-up view of the homology model of human ATGL after rotation to highlight the position of G146.

