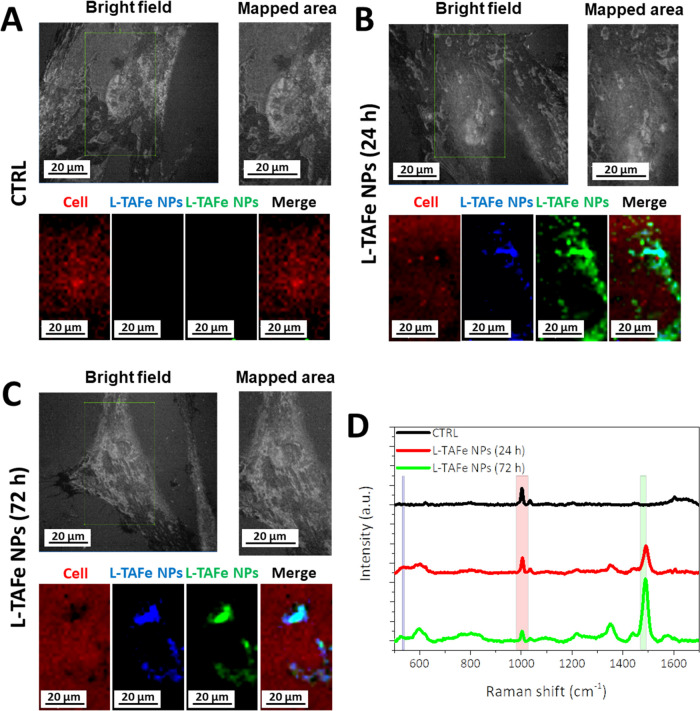
Figure 5.
(A–C) Raman microscopy of human primary skin fibroblasts treated with L-TAFe NPs (100 μg/mL) for 24 and 72 h and of control cultures. In the bright field image, the cell area mapped by Raman microscopy is highlighted by the green square and zoomed in the “mapped area”. In this area, the cell signal (red) corresponds to phenylalanine residues (980–1028 cm–1), while the L-TAFe NP signal is mapped following two contributions: Fe–O bond in blue (532–539 cm–1) and tannic acid and DSPE-PEG hydrocarbon chain vibrations in green (1470–1492 cm–1). (D) Representative Raman spectra at a selected point in the map for control cells (CTRL, black) and cells treated with L-TAFe NPs for 24 h (red) and 72 h (green); the colored boxes highlight the characteristic signals of the cells (red box) and L-TAFe NPs (blue and green box).

