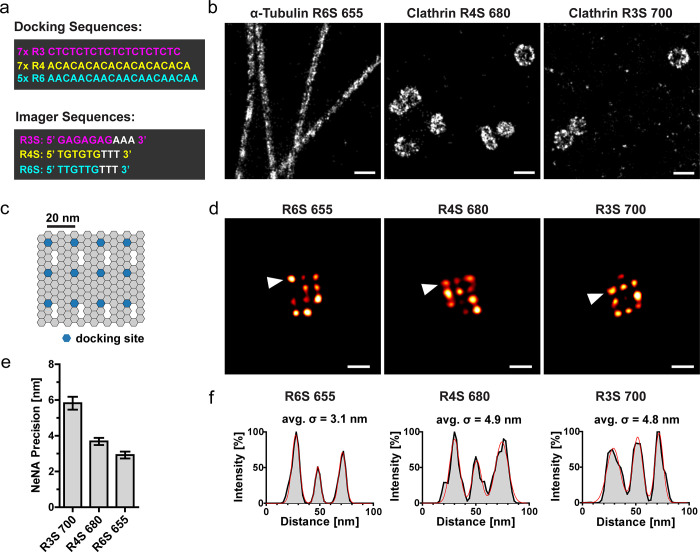
Figure 2.
Image quality and localization precision. (a) Schematic of the oligonucleotide sequences of the docking strands (R3, R4, R6) and the optimized imager strands (R3S, R4S, R6S). (b) COS-7 cells were immunolabeled with primary antibodies against nanostructures (microtubules and clathrin-coated vesicles) and secondary nanobodies conjugated to unique docking strands. Samples were imaged in SD-mode without color-filtering, using the imagers coupled to the ATTO-dyes (R6S-655, R4S-680, R3S-700) as indicated. Recording modality: 20 000 frames for ATTO 680; 30 000 frames for ATTO (655/700), 100 ms exposure, 1 nM imager concentration. Selected regions show super-resolved nanostructures. Scale bar: 200 nm. (c) Schematic of the DNA origami structure with a 3 × 4 docking site arrangement with 20 nm grid distances. (d–f) Immobilized 20 nm DNA origamis with the docking sequences (R3, R4, R6) were imaged in SD-mode without color-filtering, using the optimized imager strands (R3S, R4S, R6S) coupled to the ATTO-dyes (655/680/700) as indicated. Recording modality: 20 000 frames, 100 ms exposure, 1 nM imager. (d) Representative SD-DNA-PAINT images of DNA origamis. Scale bar: 40 nm. (e) The NeNA precision was calculated on the same single-color data set as the images in (d). Mean ± SEM, images: 655 (n = 5), 680 (n = 4), 700 (n = 3). (f) Line profiles through the origamis (arrowheads in (d)) were fitted with a multi-Gaussian distribution (red line). The standard deviation of each single Gaussian was averaged (avg. σ).

