Figure 3.
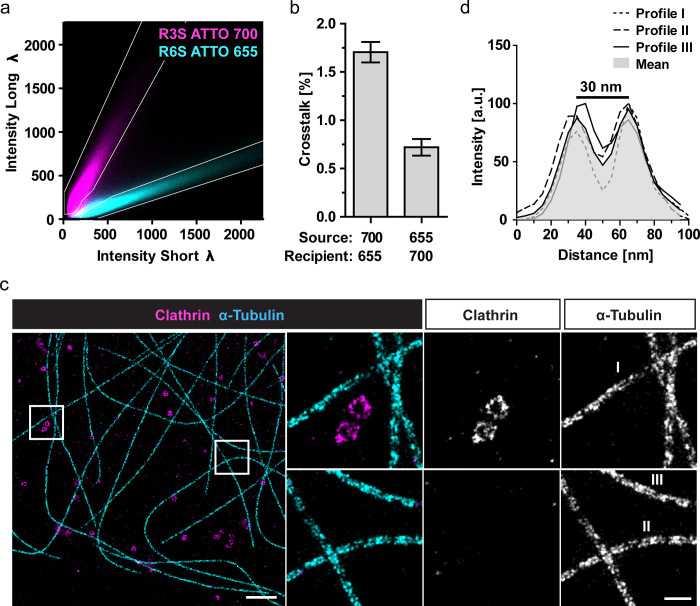
Dual-color SD-DNA-PAINT. (a,b) Single-color DNA-PAINT experiments in SD-mode using COS-7 cells immunolabeled for either clathrin (R3) or α-tubulin (R6). Recording modality: 20 000 frames, 100 ms exposure, 1 nM imager concentration. (a) Pseudocolor overlay of the 2D intensity histograms from separate single-color experiments (cyan: R6S-ATTO-655, magenta: R3S-ATTO-700, both: average of six experiments). Color-separation masks (white lines) were manually designed within the 2D intensity histogram based on the single-color experiments. (b) The crosstalk was calculated as the percentage of localizations from the source (i.e., ATTO-700) that were detected within the mask of the recipient channel (i.e., ATTO-655) based on the single-color ground truth and vice versa. Mean ± SEM, N = 4–5 images per channel. (c) COS-7 cells were immunolabeled for clathrin (R3) or α-tubulin (R6) simultaneously. Samples were imaged simultaneously in SD-mode (including color-filtering) using the imagers from (a). Representative dual-color SD-DNA-PAINT image of microtubules (R6S-655) and clathrin (R3S-700) with enlarged regions (white boxes) are shown. Scale bar: 1 μm, zoom: 200 nm. Both enlarged regions have the same contrast. Recording modality: 30 000 frames, 100 ms exposure, 1 nM total imager concentration. (d) Intensity line profiles across the indicated microtubules shown in (c). The mean profile shows a “valley-to-peak” intensity ratio of ∼50% (dotted red line).

