Figure 5.

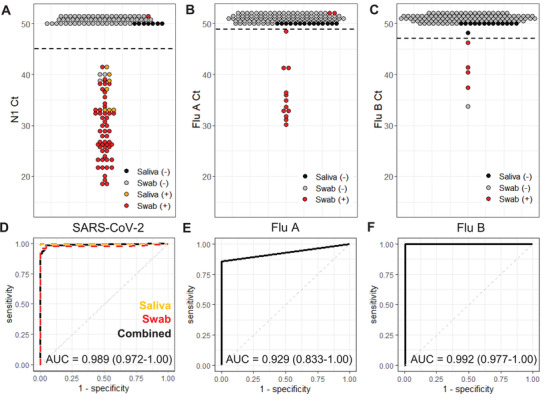
Clinical sample validation. A–C) PCR cycle threshold (Ct) values for swabs (n = 116) and saliva samples (n = 14) run in the multiplexed respiratory panel cartridges. Each point represents one sample with positive (+) and negative (−) classification determined by the benchtop comparator assay and denoted by color. All reactions with undetectable amplification are plotted with a Ct of 50 or higher. Cutoff Ct values, indicated with a horizontal dashed line for each assay, were determined for the maximum combination of the assay's sensitivity and specificity. D–F) Corresponding receiver operator curves for the SARS‐CoV‐2, Flu A, and Flu B cartridge assays. Area under the curve (AUC) is indicated with 95% confidence interval.
