
FIGURE 2.
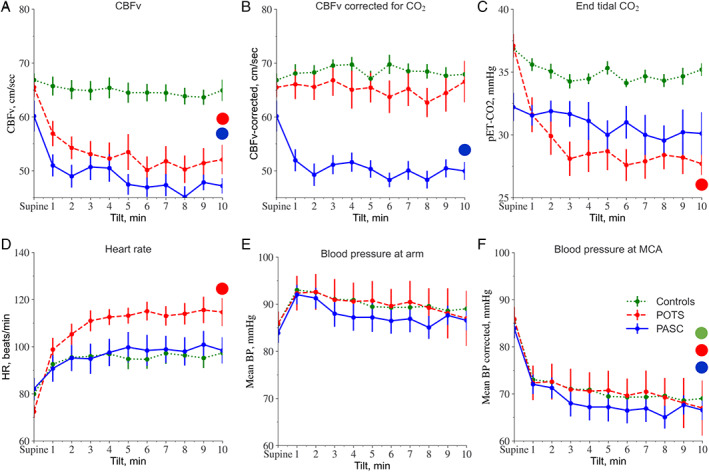
Profile of cerebral blood flow velocity (CBFv), CBFv corrected for the effect of CO2, end tidal CO2, heart rate (HR), and blood pressure (BP) during supine baseline and the tilt test for post‐acute sequelae of coronavirus disease 2019 (PASC), postural tachycardia syndrome (POTS), and controls. Large dots indicate significance at p = 0.001 level for respective data obtained by repetitive measures analysis of variance (ANOVA). [Color figure can be viewed at www.annalsofneurology.org]