FIGURE 1.
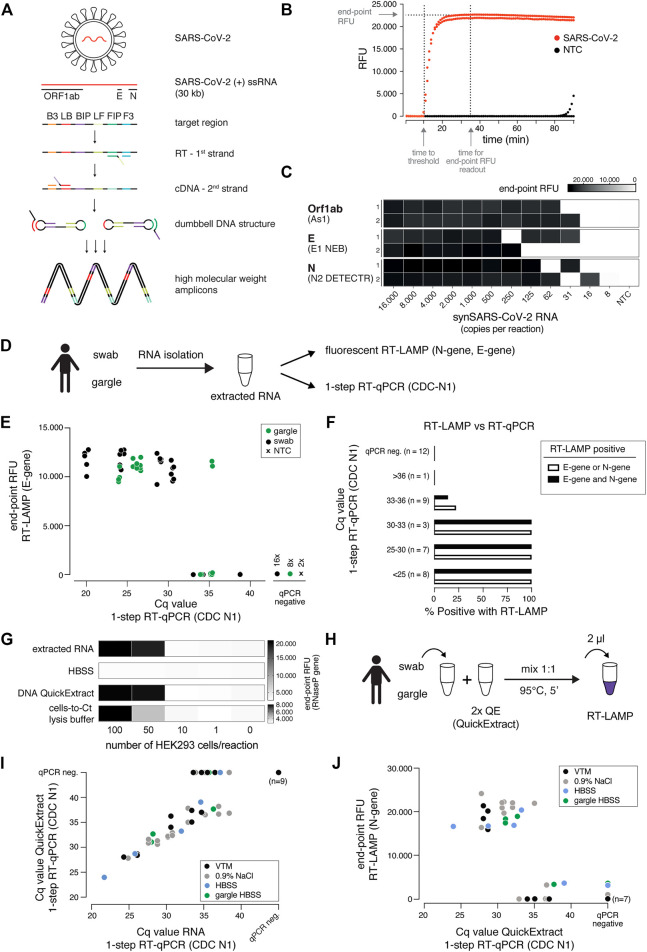
A sensitive, robust RT-LAMP assay compatible with crude patient samples. (A) Schematic illustrating loop-mediated amplification (LAMP) of SARS-CoV-2 RNA and the regions targeted in this study (Orf1ab, E and N genes; depicted above). Each target region is recognized by a defined set of primers (B3, LB, BIP, LF, FIP, F3). The RNA template (red) is reverse transcribed and displaced after first-strand synthesis; the outer primer binding sites are added in the subsequent amplification step. The resulting dumbbell DNA structure acts as template for further rounds of amplification, ultimately leading to high molecular weight amplicons. (B) Readout of a real-time fluorescence RT-LAMP reaction using 500 copies of synthetic SARS-CoV-2 (red) or water as non-targeting control (NTC, black) as input. “Time to threshold” indicates the time at which the fluorescence value reaches threshold level (equivalent to Cq value in RT-qPCR assays), “end-point RFU” indicates the fluorescence value (FAM filter set, absorption/emission at 494 nm/518 nm) after 35 min reaction time (used throughout this study unless indicated otherwise); RFU: relative fluorescence units. (C) Performance of the three top primer sets for RT-LAMP-based SARS-CoV-2 detection. End-point relative fluorescence units (RFUs) of RT-LAMP reactions (in duplicates) using the indicated primer sets and serially diluted synthetic SARS-CoV-2 RNA standard as input. Water was used as no-target control (NTC). (D) Cartoon indicating the workflow for SARS-CoV-2 detection by either RT-LAMP or 1-step RT-qPCR from patient samples (nasopharyngeal swab or gargle) with prior RNA isolation. (E) Comparison of RT-LAMP and RT-qPCR performance. Plotted are RT-LAMP end-point fluorescence values after 35 min versus the respective RT-qPCR Cq values. RNA was derived from gargle (green) or nasopharyngeal swabs (black); two no-target controls were included (black cross). Reactions in which no amplification was recorded are labelled as qPCR negative. (F) Detection rate for RT-LAMP reactions compared to a gold standard 1-step RT-qPCR assay. Shown are percentages of positive (detected in RT-LAMP and RT-qPCR) predictive agreement for sample groups (defined by RT-qPCR-derived Cq values) between RT-LAMP (using E- and/or N-gene primers) and 1-step RT-qPCR. (G) Performance of different crude sample preparation methods in RT-LAMP. Shown are end-point relative fluorescence units (RFUs) for RT-LAMP reactions targeting human RNAseP on sample inputs derived from defined numbers of HEK293 cells mixed 1:1 with indicated 2x buffers (extracted RNA served as a positive control). (H) Cartoon indicating the workflow for RT-LAMP using QuickExtract crude lysate as sample input. (I) Comparison of QuickExtract crude sample input versus extracted RNA as input using 1-step RT-qPCR. COVID-19 patient nasopharyngeal swabs or gargle samples (color coded according to the indicated collection medium) were either processed with the QuickExtract workflow (crude sample input) or RNA was extracted using an automated King Fisher RNA bead purification protocol. Reactions in which no amplification was recorded are labelled as qPCR negative. (J) Performance of RT-LAMP with QuickExtract treated crude COVID-19 patient sample input (same samples as in I). Depicted is the comparison of Cq values from RT-qPCR performed on QuickExtract treated samples versus corresponding end-point relative fluorescence units (RFUs) from RT-LAMP reactions.

