FIGURE 3.
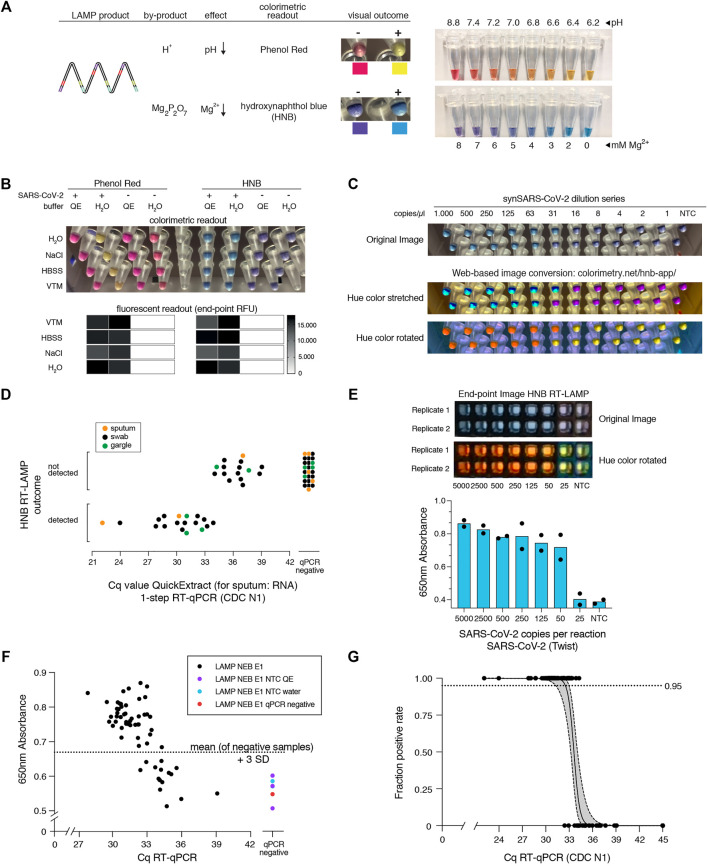
HNB RT-LAMP enables colorimetric SARS-CoV-2 detection from crude patient samples. (A) Schematic illustrating the properties of pH-sensitive (Phenol Red, top) and Mg2+ concentration sensitive (hydroxynaphthol blue, HNB, bottom) colorimetric readouts for LAMP. Phenol Red interacts with protons (H+) generated during DNA amplification, which causes a color change from pink/red to yellow (right: the color range of the Phenol Red-containing colorimetric RT-LAMP mastermix (NEB) at relevant pH values). Magnesium pyrophosphate precipitate produced during DNA amplification lowers the free Mg2+ concentration, causing a color change of the HNB dye from purple to sky-blue (right: the color range of solutions with HNB at relevant Mg2+ concentrations). (B) Influence of QuickExtract on colorimetric RT-LAMP performance using HNB or Phenol Red. Shown are RT-LAMP reaction outcomes (upper panel: colorimetric readout after 35 min, lower panel: fluorescent end-point values) when using 500 copies of synthetic SARS-CoV-2 RNA standard in indicated sample media diluted 1:1 with water or 2x QuickExtract solution as input. (C) Shown is the result from the QuickExtract HNB RT-LAMP dilution series, uploaded and color-converted via our custom web-based colorimetry tool. The top row shows the original image, middle and bottom rows are the color-stretched and color-rotated versions. (D) HNB RT-LAMP performance on COVID-19 patient samples lysed in QuickExtract solution. Shown is the binary colorimetric HNB readout of RT-LAMP reactions (N gene) using indicated patient samples (sputum (orange), swab (black), gargle (green)) plotted against the corresponding Cq values from RT-qPCR. (E) End-point 650 nm absorbance measurements from a HNB RT-LAMP dilution series. The raw and color-rotated images of the reactions are shown on the top, while the 650 nm absorbance measured by a Synergy H1 plate reader is shown below. (F) Scatter plot showing HNB RT-LAMP performance (measured by 650 nm absorbance) versus qPCR-determined Cq values on a serial dilution grid (see methods for details), including no-target controls (NTC) and a COVID-19-negative patient sample (qPCR negative). Horizontal dashed line indicates the absorbance (mean + 3SD) from five negative controls (y = 0.67). (G) Simple logistic regression analysis (Probit Model) of HNB RT-LAMP reaction outcomes performed on QuickExtract patient samples shown in Figure 3D and F using Graphpad Prism. Shown is the regression line representing detection limits, expressed as “Fraction positive rate”, at a given RT-qPCR Ct value with corresponding 95% confidence intervals (grey shading).

