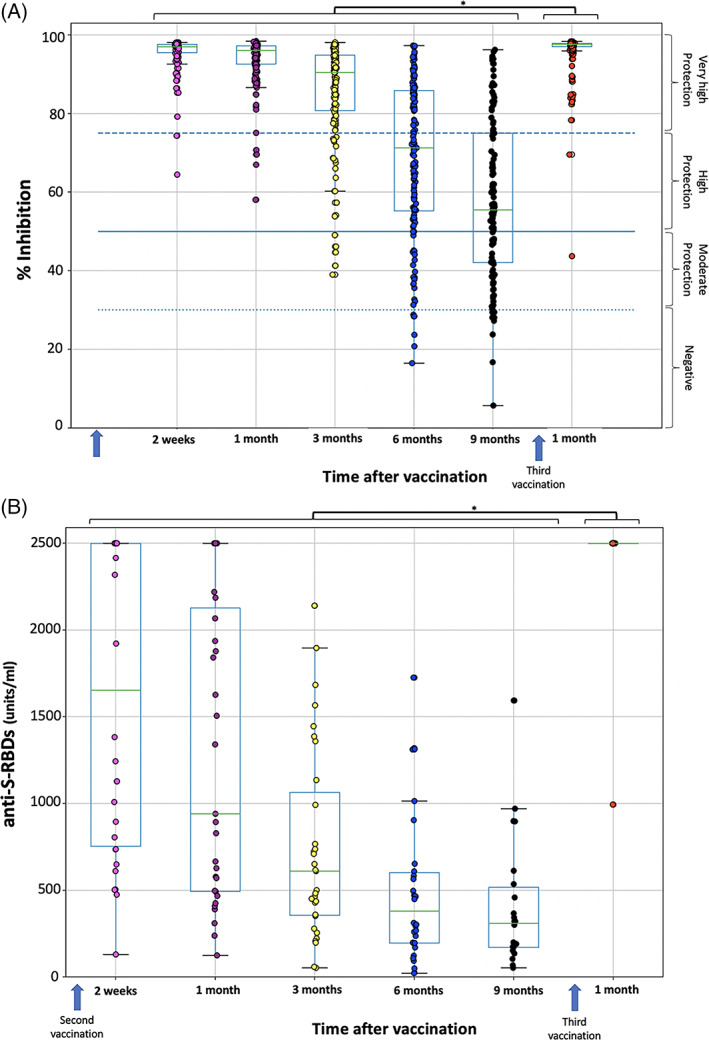
FIGURE 1.

SARS‐CoV‐2 neutralizing antibodies (% inhibition) (A) and anti‐SRBD levels (B) after second and third vaccination with BNT162b2 mRNA vaccine. Antibodies were measured 2 weeks, 1, 3, 6 and 9 months after the second vaccination and 1 month after the booster dose. Asterisks (*) indicate statistically significant differences (p value <.05) between the compared groups. The boundaries of the boxplot refer to the quartiles of the distribution, while the overlaid points represent the individual NAbs or anti‐SRBD values. The dashed lines (in A) refer to the limits of inhibition, that is, 30%, 50%, and 75%
