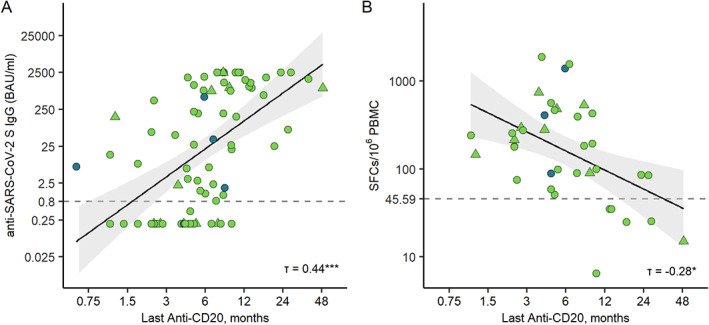
FIGURE 4.

Correlation between the time since last anti‐CD20 treatment and vaccine responses. (A) Scatter plot of antibody levels to the RBD of the spike protein and time since last anti‐CD20 treatment with linear regression line including a 95% CI. (B) Scatter plot of SFCs/106 PBMC and time since last anti‐CD20 treatment dose, with linear regression line including a 95% CI. Participants are marked as follows: Rituximab, green; Ocrelizumab, blue; BNT162b2 vaccine, circle; mRNA‐1,273 vaccine; triangle. CI = confidence interval; SARS‐CoV‐2 = severe acute respiratory syndrome‐coronavirus 2; PBMC = peripheral blood mononuclear cell; RBD = receptor‐binding domain; SFC = spot forming cell. [Color figure can be viewed at www.annalsofneurology.org]
