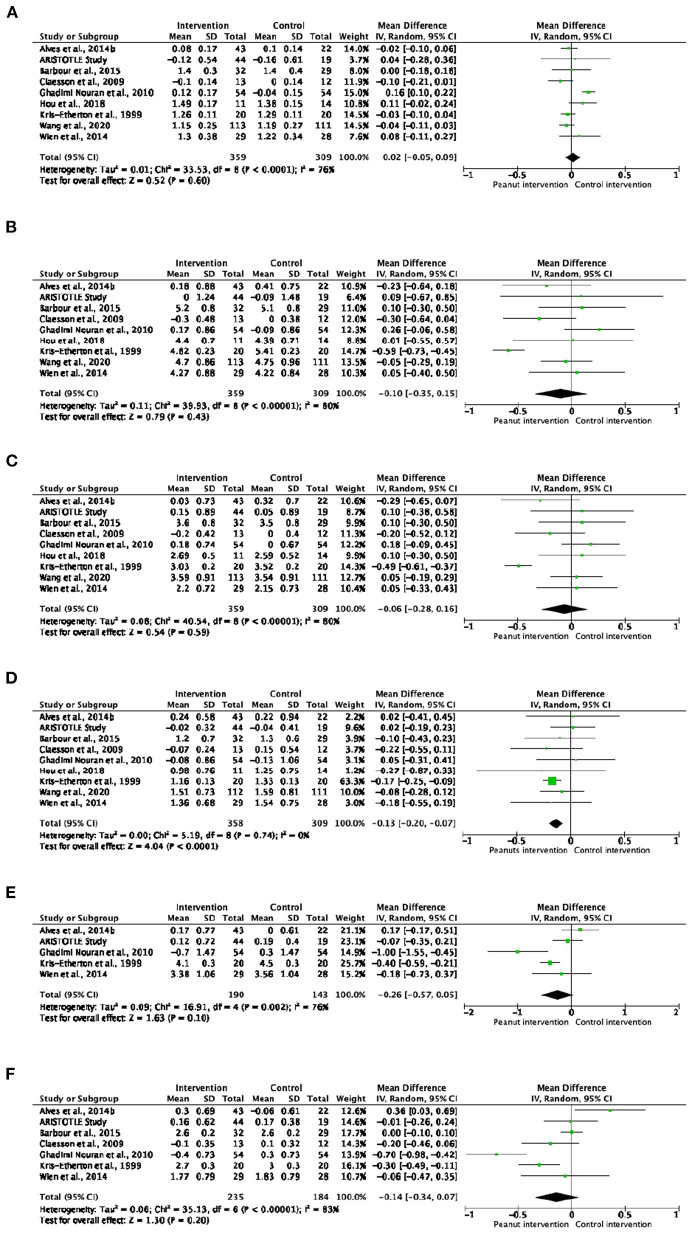
Figure 3.
Forest plot reporting mean differences for total cholesterol (A), HDL-cholesterol (B), LDL-cholesterol (C), triglycerides (D), total cholesterol/HDL-cholesterol ratio (E) and LDL-cholesterol/HDL-cholesterol ratio (F) associated with peanut interventions compared to control interventions. HDL, high-density lipoprotein; LDL, low-density lipoprotein.

