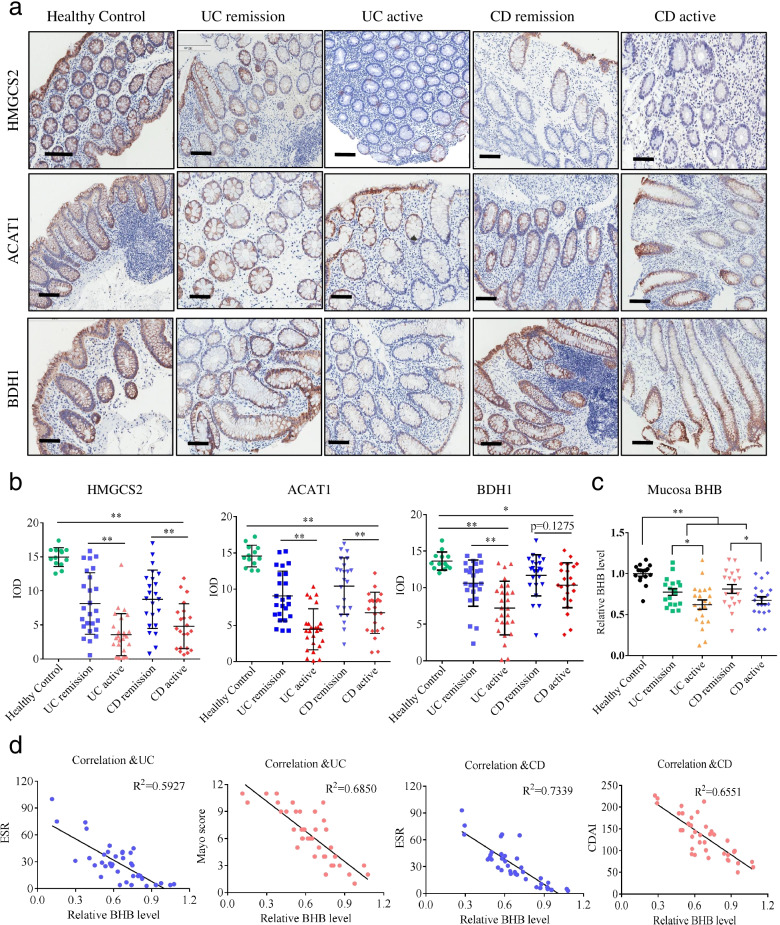
Fig. 1.
The clinical correlation of HMGCS2, ACAT1, BDH1, and BHB in IBD patients. UC, ulcerative colitis; CD, Crohn’s disease; ACAT1: acetyl-CoA acetyltransferase 1; HMGCS2, 3-hydroxymethylglutaryl-CoA synthase 2; BDH1, 3-hydroxybutyrate dehydrogenase I. IOD, integrated optical density (as measured by Image-pro-plus software). a Representative IHC images of the colonic mucosa from healthy controls and IBD patients in remission and active (scale bars: 150 μm). b IHC analyses of HMGCS2, ACAT1, and BDH1 protein in the colonic mucosa from healthy controls (n = 13), UC patients in remission (n = 25) and active (n = 26), and CD patients in remission (n = 23) and active (n = 22). c Enzymatic colorimetric assay of BHB levels in the colonic mucosa from healthy controls (n = 16), UC patients in remission (n = 18) and active (n = 21), and CD patients in remission (n = 19) and active (n = 20). d Correlation between BHB levels and the Mayo scores in UC and the CDAI scores in CD and the ESR values in IBD were calculated by Spearman correlation analyses. b, c Data represent means ± SEM; *P< 0.05, **P< 0.01 by unpaired Student’s t test

