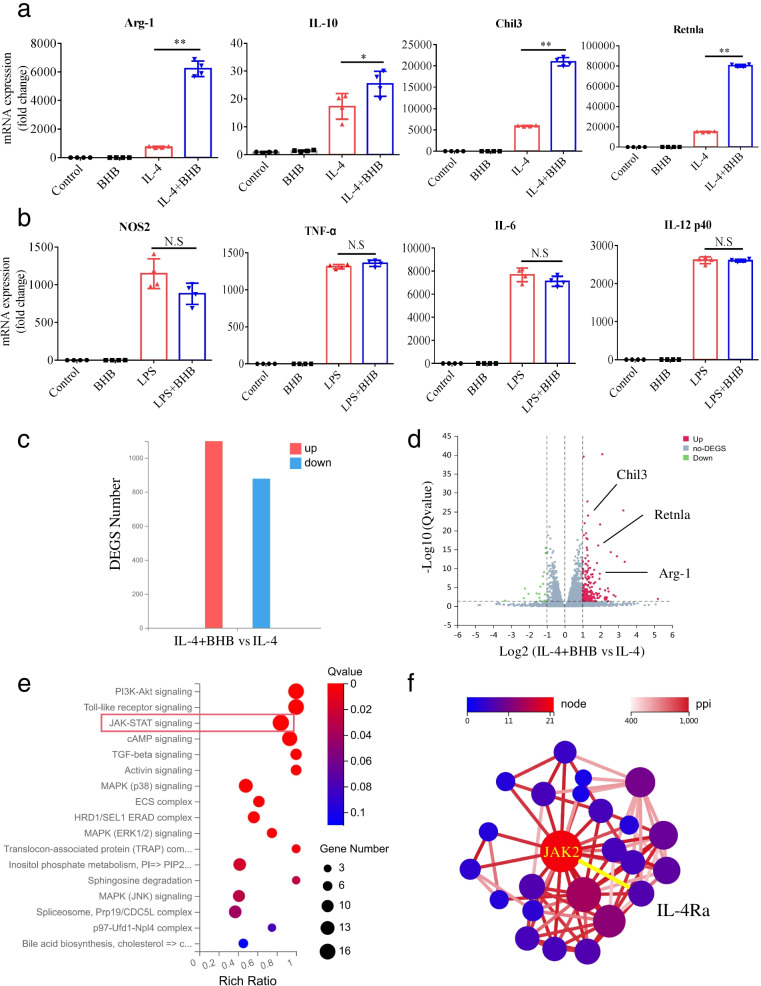
Fig. 5.
BHB promotes IL-4-induced M2 macrophage polarization in vitro. a BMDMs isolated from mice were stimulated with BHB or IL-4 alone or together. Forty-eight hours later, the relative mRNA expression levels of the indicated genes were determined by real-time PCR and normalized to GAPDH. b BMDMs isolated from mice were stimulated with BHB or LPS alone or together. Twenty-four hours later, the relative mRNA expression levels of the indicated genes were determined by real-time PCR and normalized to GAPDH. c–f BMDMs isolated from mice were stimulated with IL-4 or IL-4 plus BHB. Forty-eight hours later, differentially expressed genes (DEGS) were analyzed by RNA-sequencing. c The number of DEGS in the IL-4 plus BHB group vs the IL-4 group. Red represented upregulated DEGS and blue downregulated DEGS. d Scatter plot showing DEGS in the IL-4 plus BHB group vs the IL-4 group. Genes were plotted based on their expression levels (log10 intensity). Red and green dots represented up- and downregulated genes, respectively. M2 macrophage-specific genes were indicated. e KEGG pathway enrichment analyses of the upregulated DEGS. Dot size represents the number of DEGS, and the dot color represents the corresponding p value. f Protein–protein interaction (PPI) analyses of the upregulated DEGS. a, b Data represent means ± SEM from four independent experiments; NS, not significant; *P< 0.05, **P< 0.01 by unpaired Student’s t test

