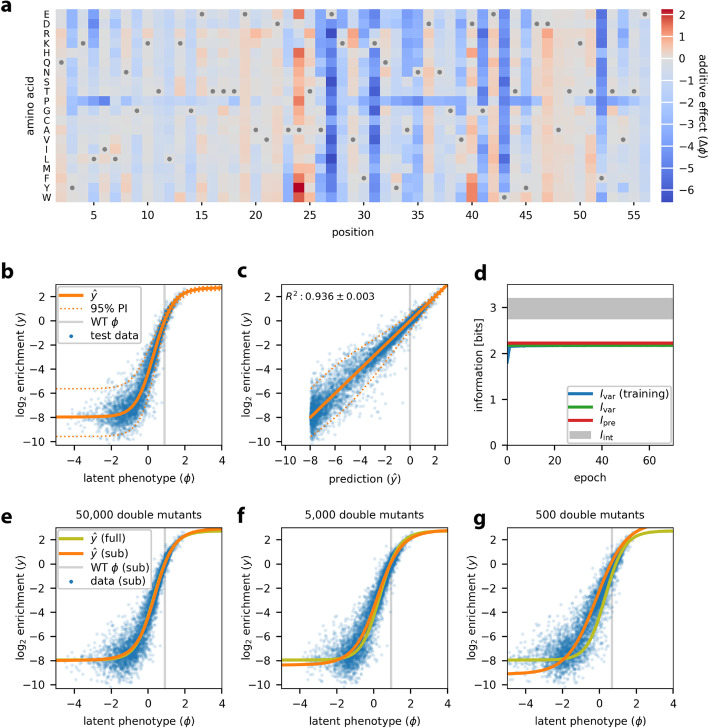
Fig. 3.
Analysis of DMS data for protein GB1. MAVE-NN was used to infer a latent phenotype model, consisting of an additive G-P map and a GE measurement process with a heteroscedastic skewed-t noise model, from the DMS data of Olson et al. [8]. All 530,737 pairwise variants reported for positions 2 to 56 of the GB1 domain were analyzed. Data were split 90:5:5 into training, validation, and test sets. a The inferred additive G-P map parameters. Gray dots indicate wildtype residues. Amino acids are ordered as in Olson et al. [8]. b GE plot showing measurements versus predicted latent phenotype values for 5000 randomly selected test set sequences (blue dots), alongside the inferred nonlinearity (solid orange line) and the 95% PI (dotted orange lines) of the noise model. Gray line indicates the latent phenotype value of the wildtype sequence. c Measurements plotted against predictions for these same sequences. Dotted lines indicate the 95% PI of the noise model. Gray line indicates the wildtype value of . Uncertainty in the value of R2 reflects standard error. d Corresponding information metrics computed during model training (using training data) or for the final model (using test data). The uncertainties in these estimates are very small—roughly the width of the plotted lines. Gray shaded area indicates allowed values for intrinsic information based on the upper and lower bounds estimated as described in “Methods.” e–g Test set predictions (blue dots) and GE nonlinearities (orange lines) for models trained using subsets of the GB1 data containing all single mutants and 50,000 (e), 5000 (f), or 500 (g) double mutants. The GE nonlinearity from panel b is shown for reference (yellow-green lines). DMS: deep mutational scanning; GB1: protein G domain B1; GE: global epistasis; G-P: genotype-phenotype; PI: prediction interval

