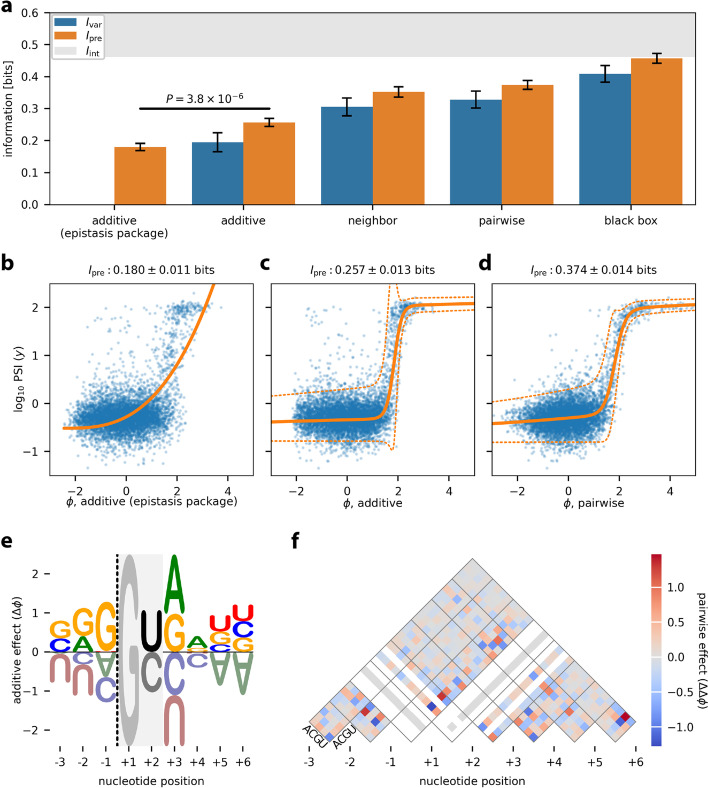
Fig. 5.
Analysis of MPSA data from Wong et al. [11]. This dataset reports PSI values, measured in the BRCA2 exon 17 context, for nearly all 32,768 variant 5′ss of the form NNN/GYNNNN. Data were split 60:20:20 into training, validation, and test sets. Latent phenotype models were inferred, each comprising one of four types of G-P map (additive, neighbor, pairwise, or black box), together with a GE measurement process having a heteroscedastic skewed-t noise model. The epistasis package of Sailer and Harms [28] was also used to infer an additive G-P map and GE nonlinearity. a Performance of trained models as quantified by Ivar and Ipre, both computed on test data. The lower bound on Iint was estimated from experimental replicates (see “Methods”). The p-value reflects a two-sided Z-test. Ivar was not computed for the additive (epistasis package) model because that package does not infer an explicit noise model. b–d Measurement values versus latent phenotype values, computed on test data, using the additive (epistasis package) model (b), the additive model (c), and the pairwise model (d). The corresponding GE measurement processes are also shown. e Sequence logo [40] illustrating the additive component of the pairwise G-P map. Dashed line indicates the exon/intron boundary. The G at +1 serves as a placeholder because no other bases were assayed at this position. At position +2, only U and C were assayed. f Heatmap showing the pairwise component of the pairwise G-P map. White diagonals correspond to unobserved bases. Additional file 1: Fig. S3 shows the uncertainties in the values of parameters that are illustrated in panels e and f. Error bars indicate standard errors. MPSA: massively parallel splicing assay; PSI: percent spliced in; G-P: genotype-phenotype; GE: global epistasis

