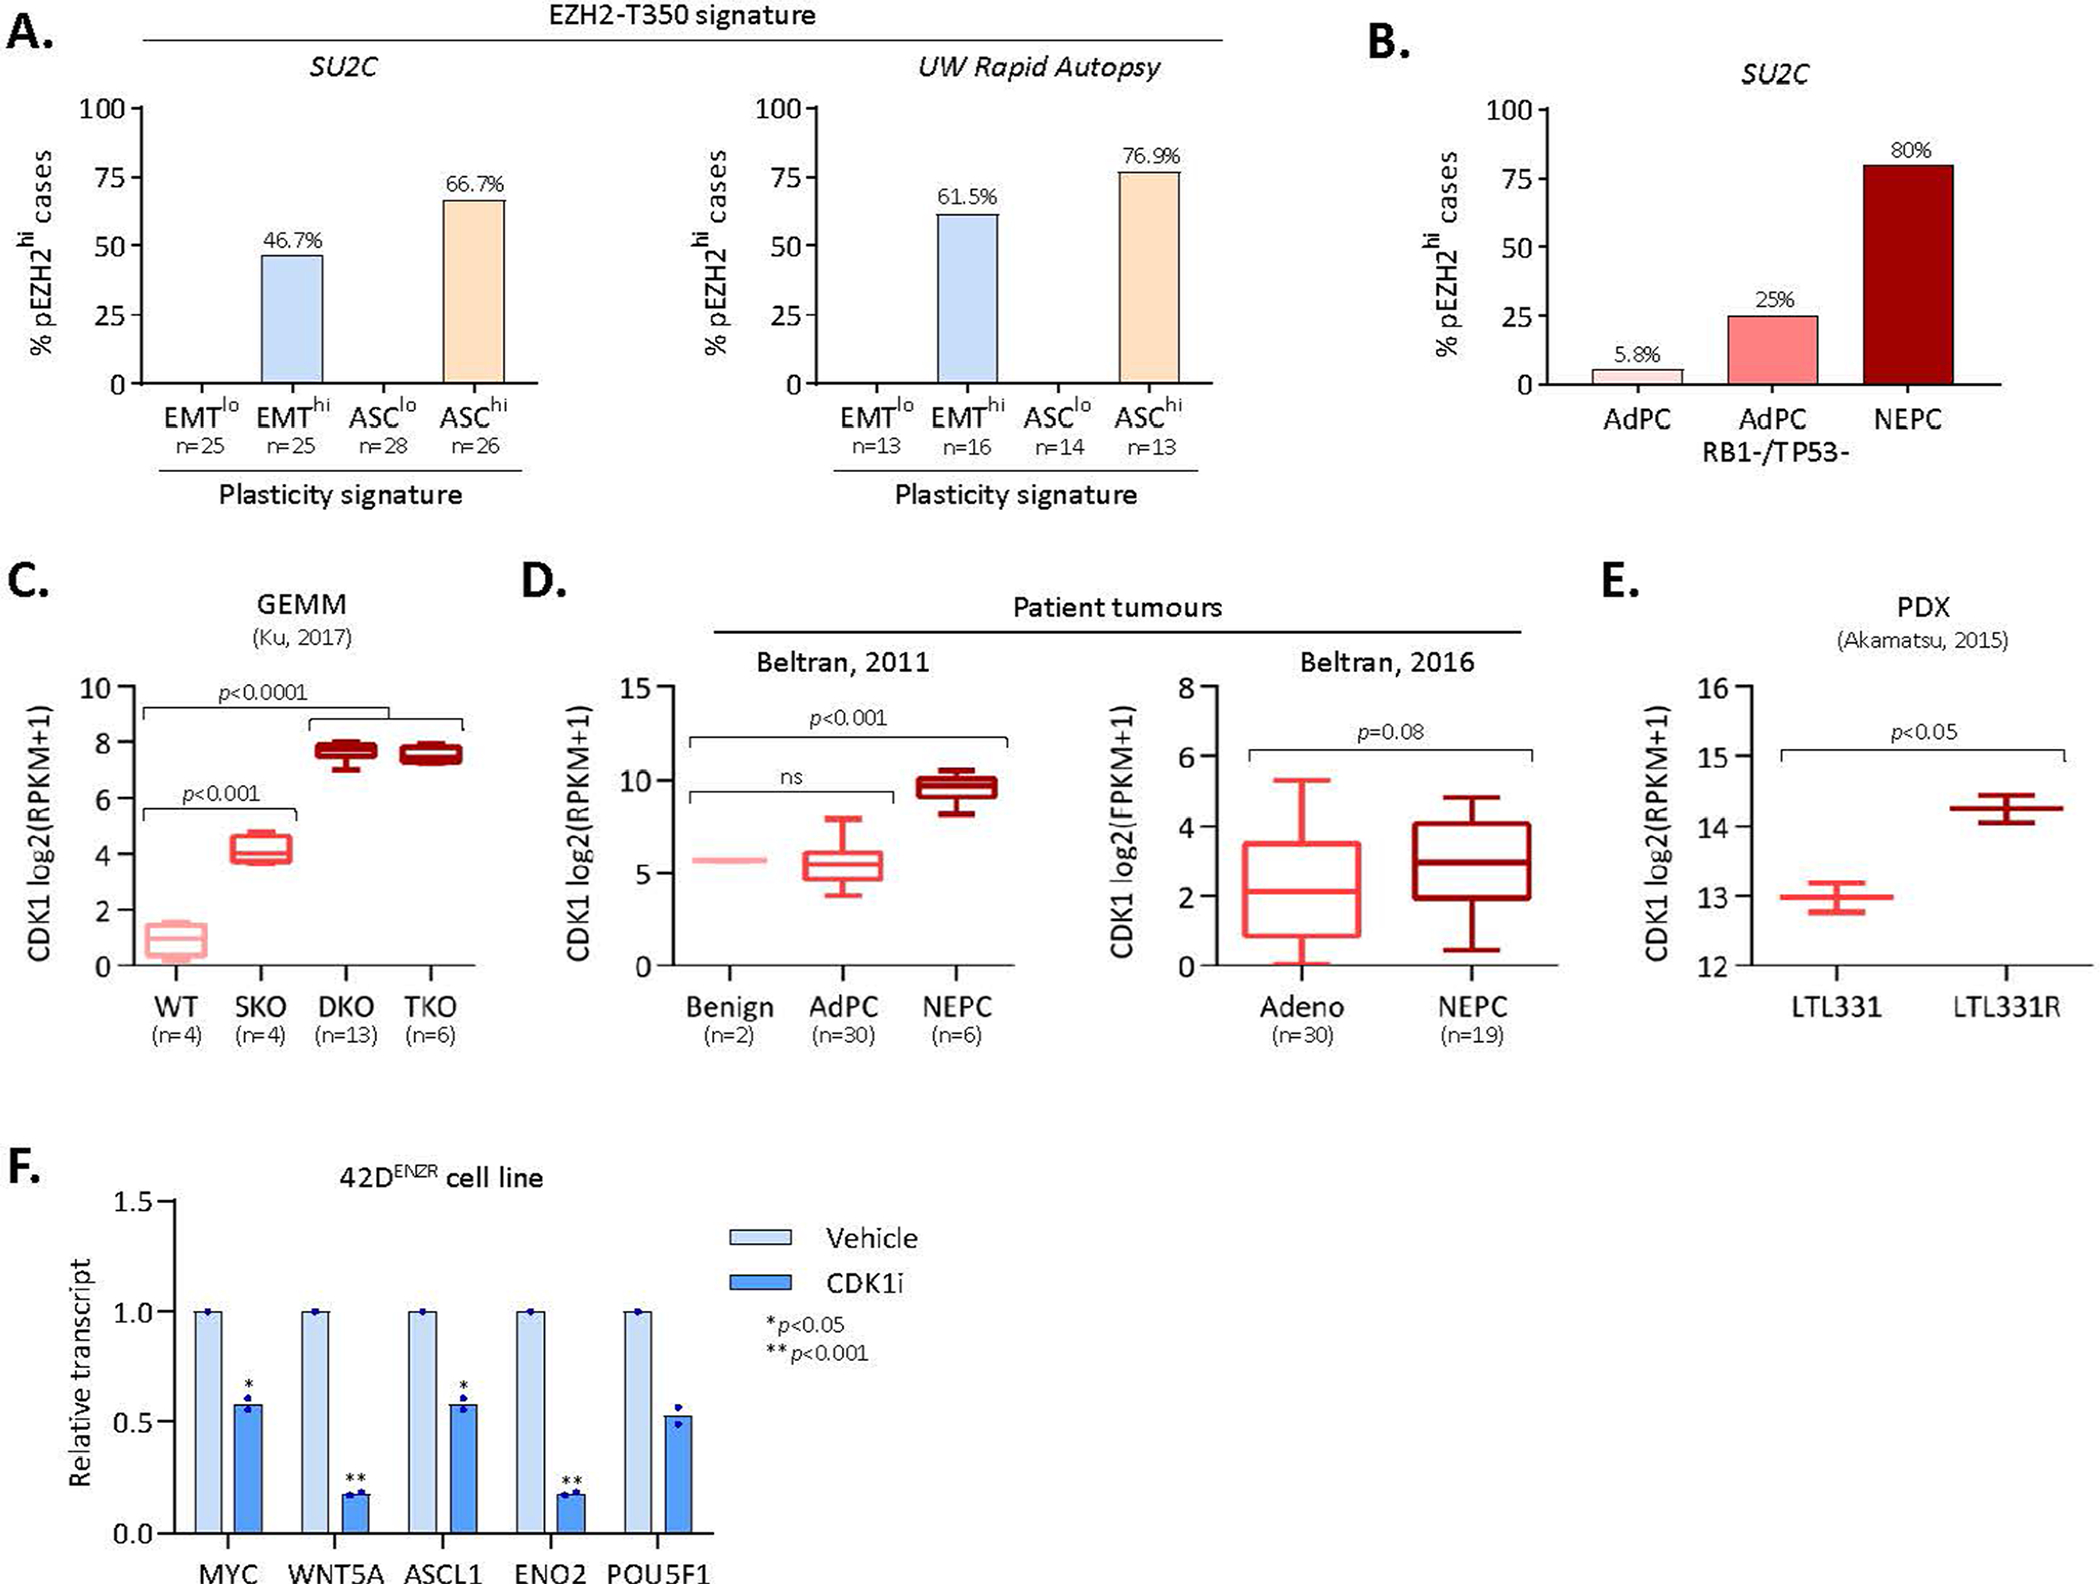
Extended Data Fig. 6 |. pEZH2-T350 is associated with lineage plasticity.

(a) Frequency of patients with low and high EMT and ASC signature scores in the SU2C37 and Labrecque et al clinical cohorts that exhibit a high pEZH2-T350 score (indicative of pEZH2-T350 phosphorylation). Patients were defined as “lo” or “hi” for each signature based on +/− 1 standard deviation from the mean signature score in the respective cohort. (b) Frequency of patients with high pEZH2-T350 score (defined as ≥1 standard deviation from cohort mean) in adenocarcinoma, adenocarcinoma with genomic RB1/TP53 loss, and NEPC patient tumours from the SU2C clinical cohort. (c) CDK1 transcript abundance in a GEMM model of prostate adenocarcinoma to NE-like tumour evolution (GEO: GSE90891). DKO and TKO tumours mimic NE-like tumours. SKO, PBCre4:Ptenf/f; DKO, PBCre4:Ptenf/f;Rb1f/f; TKO, PBCre4:Ptenf/f;Rb1f/f;Trp53f/f. Statistical analysis was performed using a two-tailed unpaired t-test. Box plots show mean and interquartile range. (d) CDK1 transcript abundance in benign prostate, adenocarcinoma (AdPC), and NEPC patient specimens from the 2011 Beltran cohort and 2016 Beltran cohort. Statistical analysis was performed using a two-tailed unpaired t-test. Box plots show mean and interquartile range. (e) CDK1 transcript abundance in a patient-derived xenograft (PDX) model of adenocarcinoma (LTL331) to NEPC (LTL331R) lineage conversion following androgen deprivation (castration) (ENA: PRJEB9660). Statistical analysis was performed using a two-tailed unpaired t-test. Mean with min/max range is reported. (f) Expression (qRT-PCR) of genes in 42DENZR cells following treatment with CDK1 inhibitor (5 μM RO-3306) for 24 hours. Data are reported relative to vehicle treated cells (mean ± SD; two-tailed unpaired t-test, n = 2).
