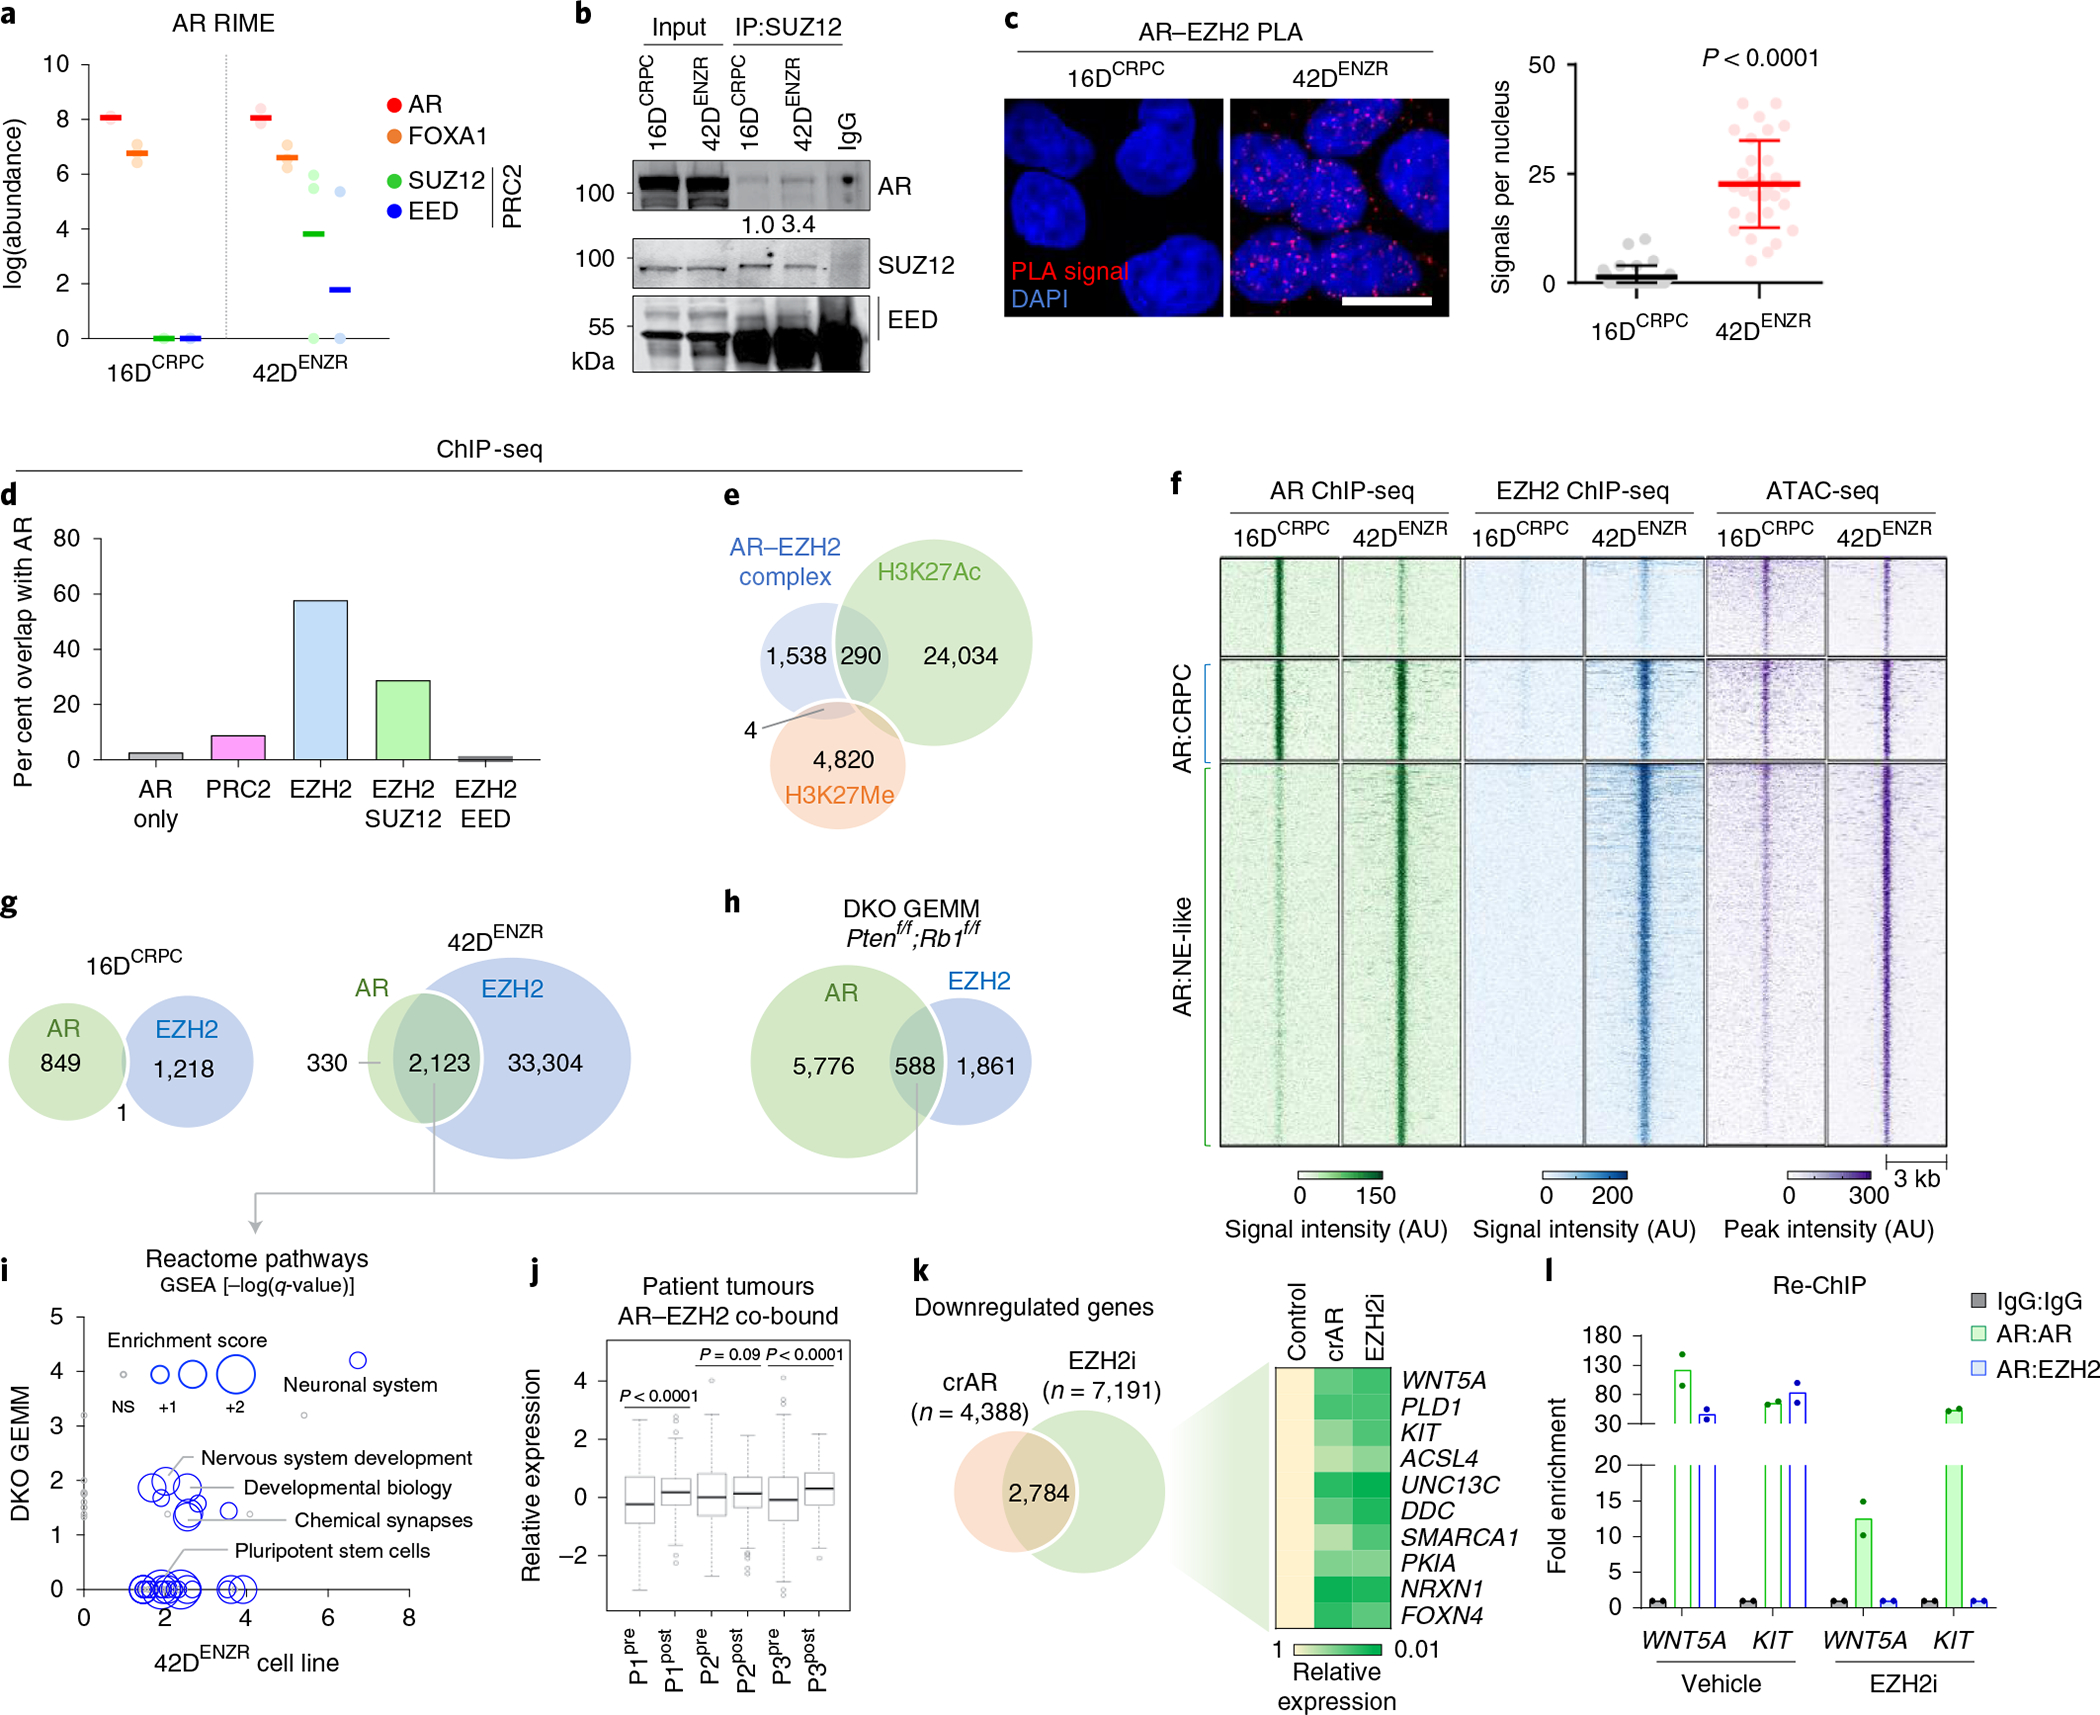
Fig. 2 |. The AR functions in a non-canonical polycomb complex with EZH2.

a, Abundance of AR, FOXA1, SUZ12 and EED peptides detected using RIME with AR antibodies as bait. Each dot represents an independent replicate, with a solid line denoting the mean. b, SUZ12 immunoprecipitation (IP) followed by immunoblotting for AR and PRC2 subunits. The relative abundance of AR was normalized to SUZ12 pulldown. c, AR–EZH2 PLA and quantification of nuclear PLA signals (red dots) from a single plane (mean ±s.d.; P < 0.0001, two-tailed unpaired t-test; n = 3). Each dot represents the number of PLA signals in a single nucleus. Scale bar, 10 μm. d, Frequency of AR-bound genes with EZH2, SUZ12 and/or EED co-occupancy based on ChIP-seq peak annotation (±50 kb from the nearest TSS) in 42DENZR cells. e, Overlap of genomic regions co-occupied by AR and EZH2 ChIP-seq peaks (AR–EZH2 complex) with ChIP-seq peaks for the H3K27Me3 and H3K27Ac in 42DENZR cells. f, Heat map of AR and EZH2 ChIP-seq signal intensity in 16DCRPC and 42DENZR cells, with corresponding ATAC-seq peak intensity. g, Overlap of AR and EZH2 ChIP-seq peaks in 16DCRPC and 42DENZR cell lines. h, Overlap of AR and EZH2 ChIP-seq peaks in the Ptenf/f;Rb1f/f (DKO) GEMM. i, Enriched reactome pathways with genes co-occupied by AR–EZH2 in 42DENZR cells and the Ptenf/f/Rb1f/f GEMM. The size of each circular data point reflects the degree to which genes in the pathway are enriched based on RNA-seq from 42DENZR compared with 16DCRPC cells. NS, not significant. j, Expression of AR–EZH2 co-bound genes in matched prostate tumours (P1–P3) pre- and post-ENZ therapy (n = 3) from the DARANA trial. Box plot shows mean and interquartile range. Statistical analysis was performed using a paired t-test. k, Venn diagram of overlap in genes downregulated (log2FC < 1) in 42DENZR cells following depletion of AR using CRISPR (crAR) or EZH2 inhibition (10 μm GSK126; 96 h). The heat map depicts relative expression of select AR–EZH2 co-bound genes, reported relative to parental cells. l, Sequential ChIP (Re-ChIP) for selected binding sites in 42DENZR cells treated with vehicle or EZH2 inhibitor (10 μm GSK126, 96 h). Cells were first analysed by chromatin immunoprecipitation with AR antibody and then immunoprecipitated again with an AR or EZH2 antibody, as indicated. Results are reported relative to IgG control (mean ± s.d., n = 2).
