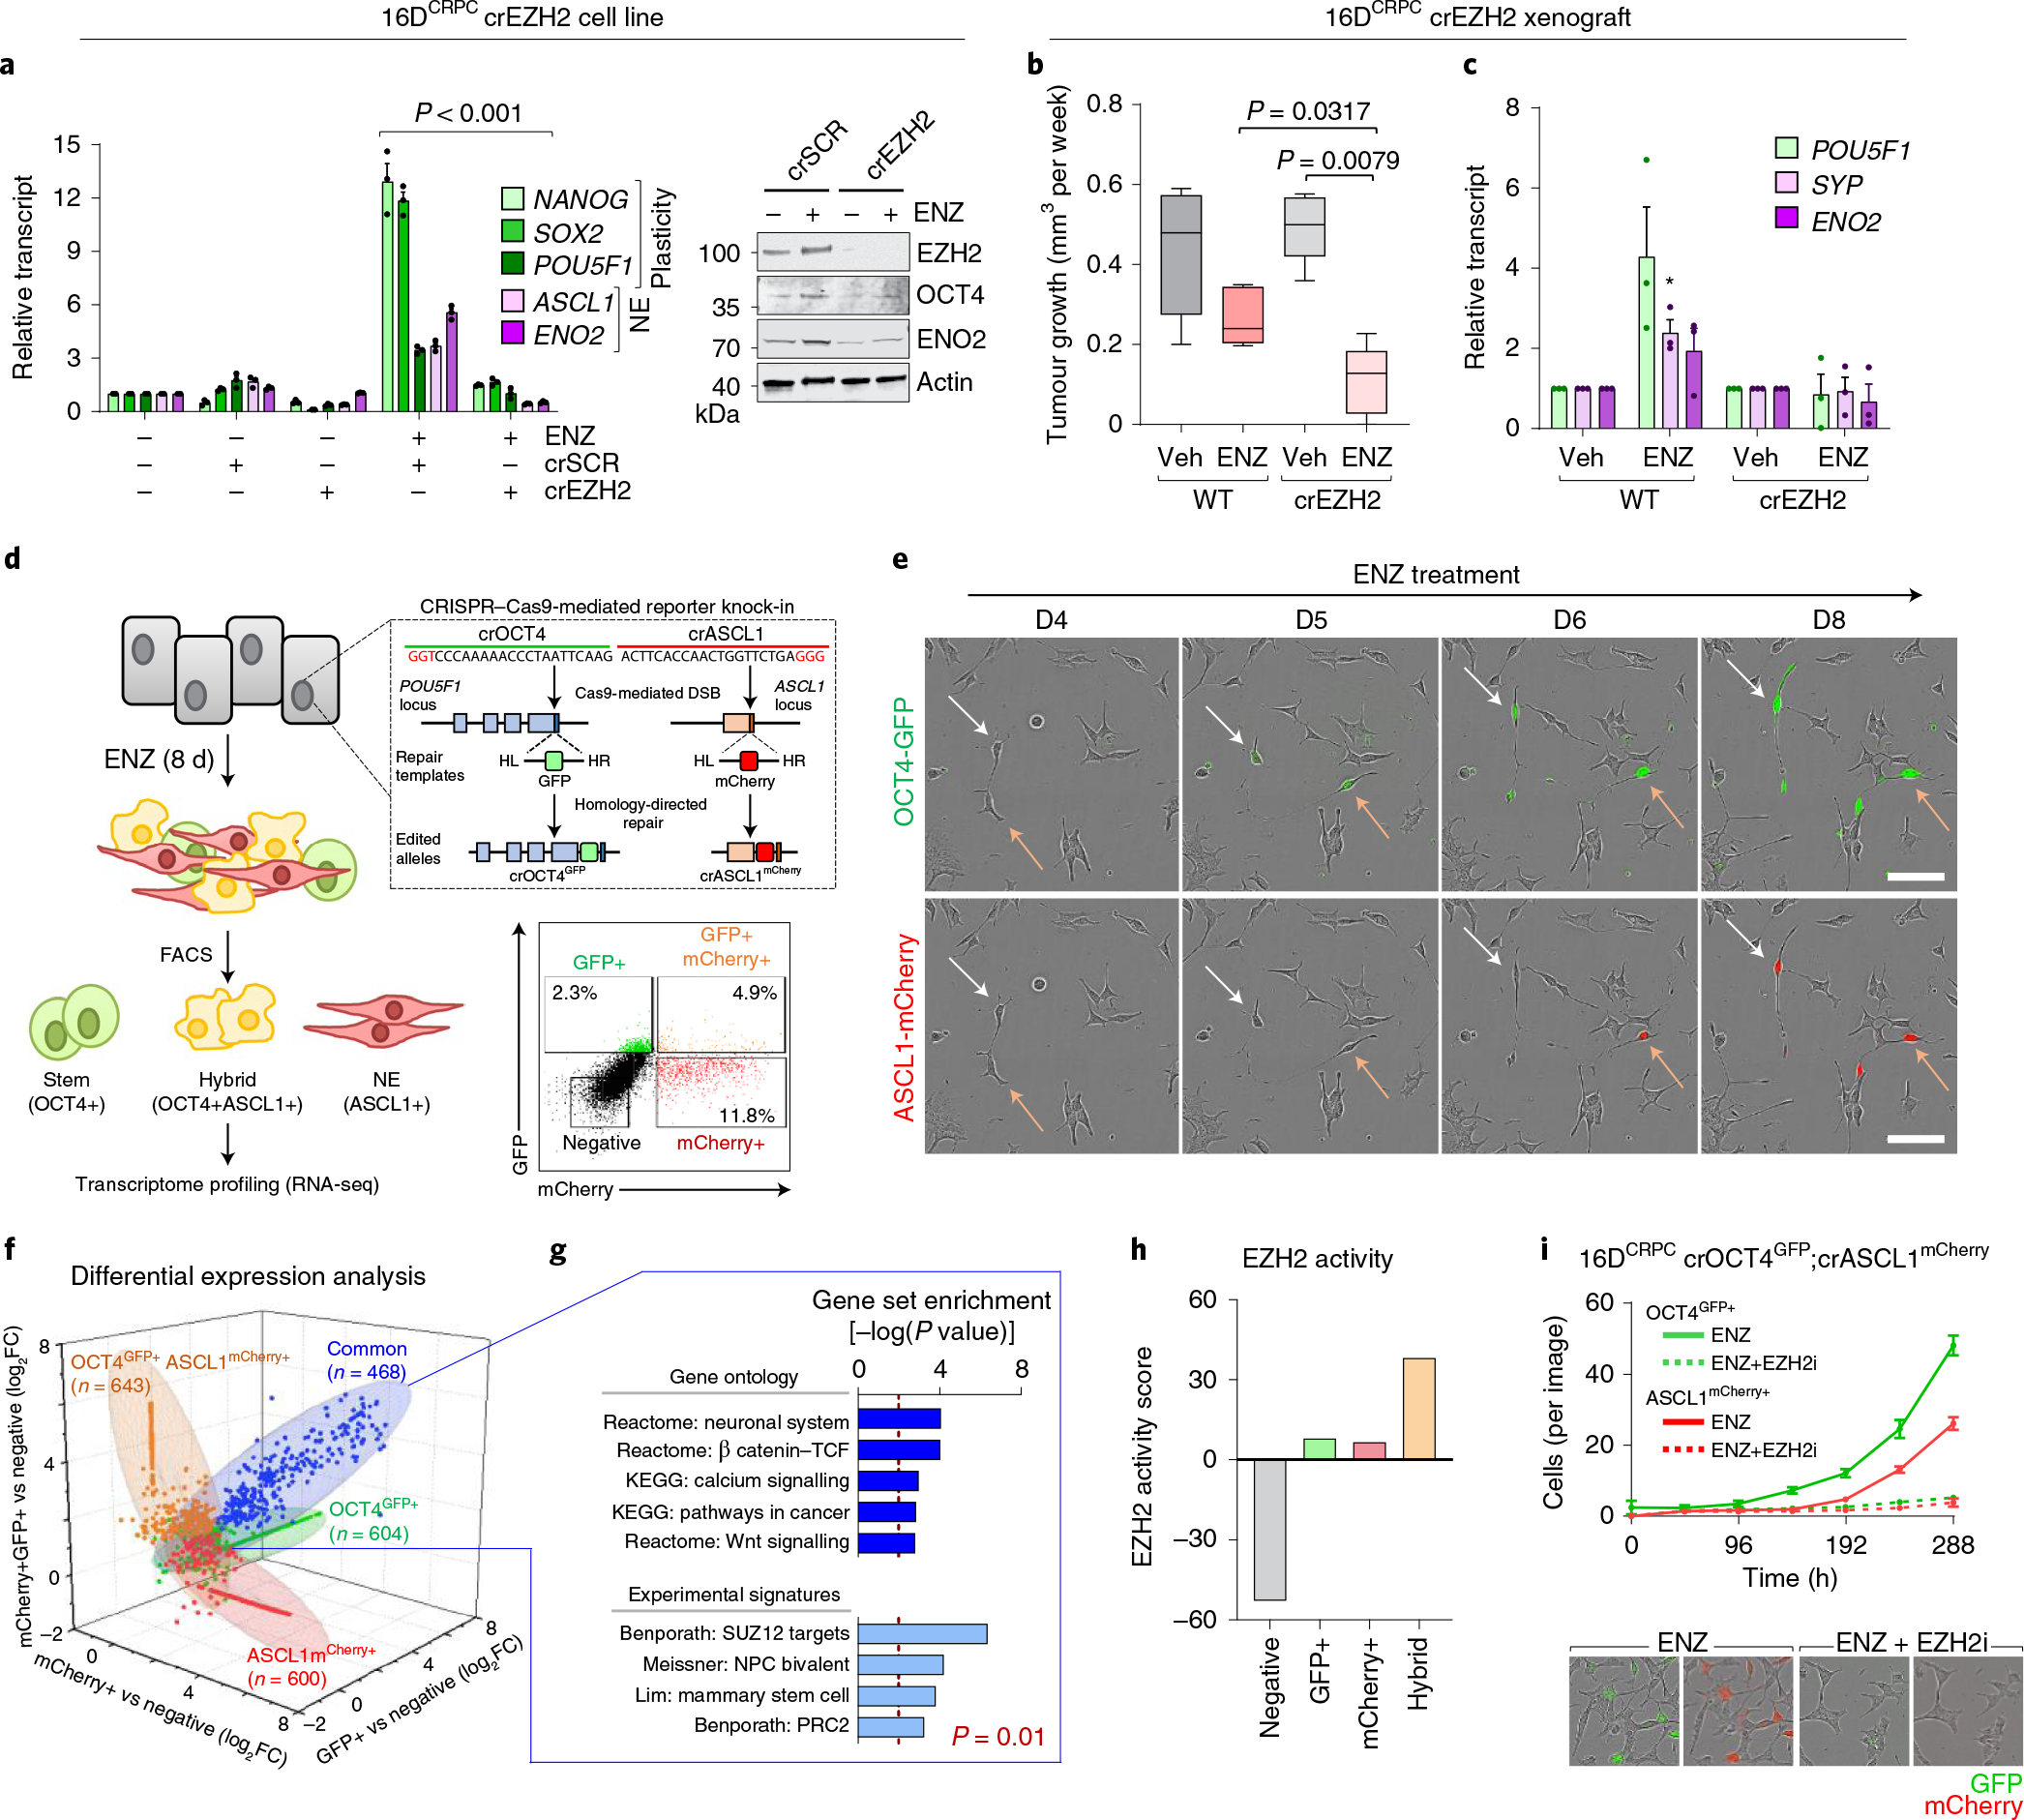
Fig. 3 |. EZH2 is required to establish the lineage-infidelity state.

a, Expression of plasticity and neuroendocrine markers by real-time PCR (rtPCR) and Western blot in 16DCRPC cells with CRISPR-mediated EZH2 knockout (16DCRPC crEZH2) following 7 d ENZ treatment. Cells transfected with a non-silencing scrambled guide RNA (crSCR) served as a control. Data are reported relative to non-transfected cells (mean ± s.d., n = 3). Two-tailed unpaired t-test. b, Tumour growth velocity of CRPC cells with CRISPR-mediated EZH2 knockout transplanted subcutaneously into nude mice, followed by treatment with vehicle (veh) or ENZ (n = 5 mice per group). Box plots show mean and interquartile range. Mann–Whitney test. c, Gene expression analysis (by rtPCR) in 16DCRPC control and crEZH2 xenograft tumours at the experimental end point. Data are reported relative to vehicle-treated mice (mean ± s.d.; *P = 0.05, two-tailed unpaired t-test; n = 3 mice per treatment group). d, Strategy used to establish the 16Dreporter cell line carrying GFP and mCherry fluorescent reporters in the endogenous OCT4 and ASCL1 loci, respectively. Fluorescence-activated cell sorting (FACS) plot shows gating used to isolate the individual cell populations. HL, left homology arm; HR, right homology arm. e, Immunofluorescence images for OCT4-GFP (green) and ASCL1-mCherry (red) in CRPCreporter cells at the indicated time points after ENZ treatment. Single cells were tracked and are denoted with arrows. Scale bar, 100 μm. f, Fold change in transcript abundance of genes unique and common to the OCT4+, ASCL1+ and hybrid (OCT4+ASCL1+) FACS-isolated CRPCreporter cell populations relative to the negative population (log2FC cut-off of 1.5), by RNA-seq. g, MSigDB pathways enriched for common genes (n = 468) upregulated (defined as log2FC > 1.5) across OCT4+, ASCL1+ and hybrid (OCT4+ASCL1+) CRPCreporter populations relative to the negative population. Statistical analysis was performed using a hypergeometric test. h, EZH2 activity score, calculated on the basis of z-score-transformed expression of genes in the ‘Kondo EZH2 targets’ signature from MSigDB, in negative, OCT4+, ASCL1+ and hybrid (OCT4+ASCL1+) CRPCreporter FACS-isolated cell populations. i, Quantification of GFP+ and ASCL1+ fluorescent CRPCreporter cells following treatment with ENZ (10 μM) alone or in combination with EZH2 inhibitor (10 μM GSK126) using the IncuCyte fluorescent object counting algorithm (mean ± s.d., n = 2). Representative images at 8 d after treatment are shown. Scale bar, 50 μm.
