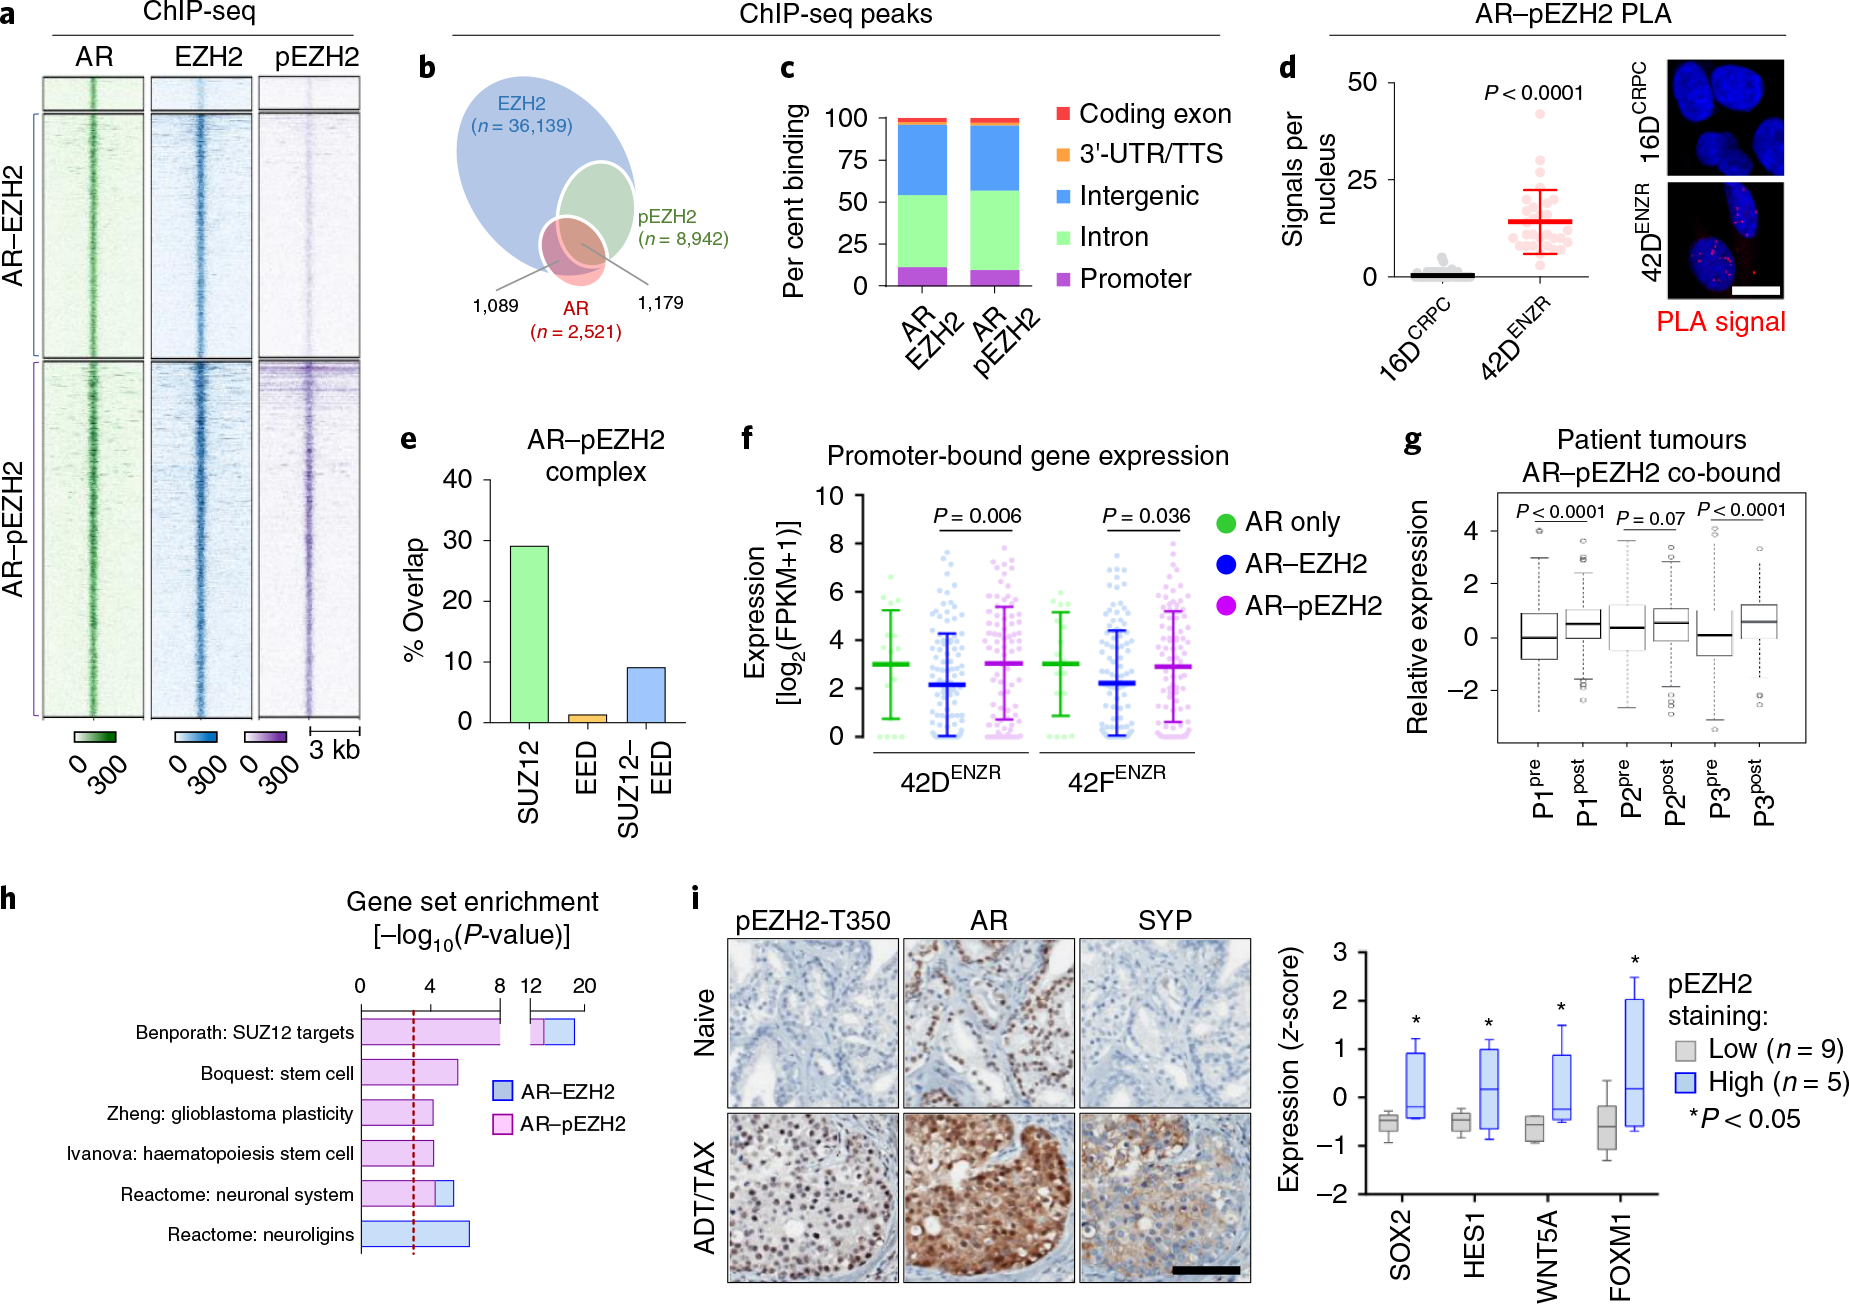
Fig. 6 |. AR and pEZH2-T350 co-operate to activate lineage-plastic transcriptional programmes.

a, Heat map of AR, EZH2 and pEZH2-T350 ChIP-seq binding intensity in 42DENZR cells. Each horizontal line represents a 6-kb locus. b, Frequency of AR ChIP-seq peaks overlapping with EZH2 and pEZH2-T350 ChIP-seq peaks in 42DENZR cells. c, Distribution of AR–EZH2 and AR–pEZH2 co-bound peaks in relation to the TSS. Peaks were mapped into 5-kb bins. d, PLA analysis of the interaction between AR and pEZH2-T350, and quantification of nuclear PLA signals (red dots) from a single plane (mean ± s.d.; P = 3.8 × 10⁻¹⁰, two-tailed unpaired t-test; n = 3). Each dot represents the number of PLA signals in a single nucleus. Scale bar, 10 μm. e, Overlap of genes co-bound to AR–EZH2 occupied by SUZ12- and/or EED, based on ChIP-seq peak annotation in 42DENZR cells. Gene annotation was restricted to ±50 kb from TSS. f, Expression of genes with promoter-bound (defined as ±3 kb from TSS) AR alone or co-occupancy with EZH2 or pEZH2-T350 in 42DENZR and 42FENZR cell lines. Data are mean expression ± s.d., with significance assessed using a two-tailed unpaired t-test. g, Expression of AR–pEZH2 co-bound genes in matched individual patient tumours pre- and post-ENZ therapy from the DARANA trial (n = 3). Box plots show mean and interquartile range. Statistical analysis was performed using a paired t-test. h, Gene ontology signatures from MSigDB enriched for AR–EZH2 and AR–pEZH2 co-bound genes in 42DENZR cells. Statistical analysis was performed using a hypergeometric test. i, Immunohistochemical staining for AR, pEZH2-T350 and SYP (neuroendocrine marker) in serial sections from non-treated (naive) and neoadjuvant ADT/TAX-treated (4.5 months) prostate tumours from the CALGB 90203 clinical trial. Treated tumours were binned on the basis of pEZH2-T350 staining intensity, and matched NanoString-based sequencing was used to assess the expression of plasticity factors in pEZH2-low (n = 8) and pEZH2-high (n = 4) tumours. Box plots show mean and interquartile range of z-score-transformed expression values with significance assessed using a two-tailed unpaired t-test. Scale bar, 100 μm.
