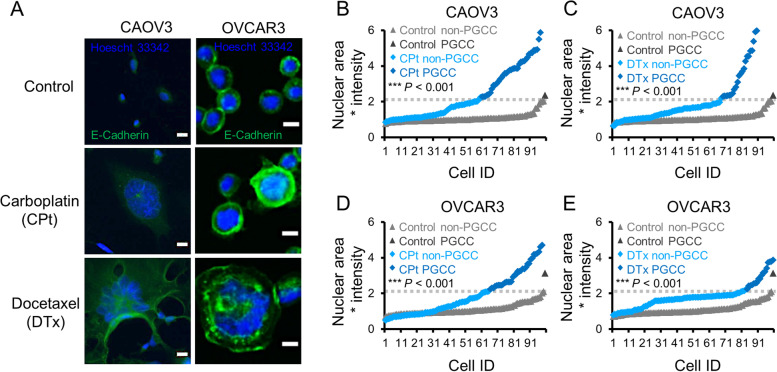
Fig. 2.
Carboplatin (CPt) and docetaxel (DTx) induce the formation of CAOV3 and OVCAR3 PGCCs. A Representative photomicrographs of CAOV3 and OVCAR3 PGCCs formed by 10 µM CPt or 5 nM DTx are shown. E-Cadherin stain (green) was used to allow cytoplasmic determination, while Hoescht 33342 (blue) was used for nuclei quantitation. Note E-Cadherin well delineates cell–cell junctions in bound OVCAR3 cells. Scale bars are 10 µm. B CAOV3 cells were treated with 10 µM CPt or vehicle control (72 h treatment) and assessed for PGCC formation (72 h after CPt removal, by Hoescht 33342 quantitation). Threshold for PGCC identification is indicated by dashed gray line. C CAOV3 cells were similarly assessed for PGCC formation induced by 5 nM DTx. D, E OVCAR3 cells were similarly assessed for PGCC formation rates. P-values indicated Fisher’s exact test result, and 100 cells quantified from two independent experiments are shown

