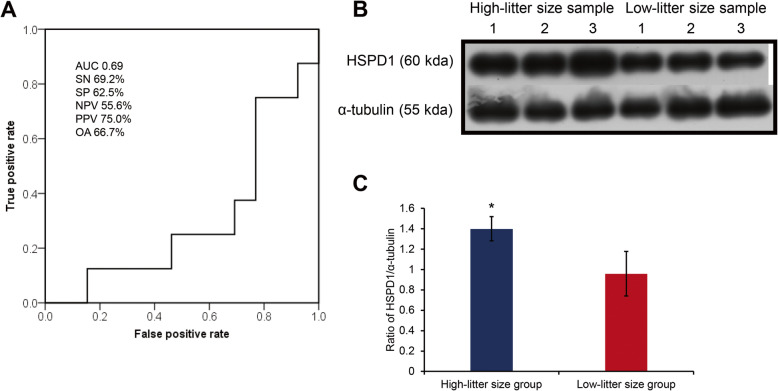
Fig. 3.
Quality assessment of HSPD1 mRNA marker and protein expression. A Receiver operating characteristic (ROC) curve of HSPD1 mRNA expression versus litter size. All the predictive parameters were calculated based on the average litter size (12.68) of samples. AUC, Area under the curve. Sensitivity (SN) is the percentage of boars showing true-positive results when tested with mRNA expression. Specificity (SP) is the percentage of boars showing true-negative results. The positive predictive value (PPV) is the percentage of boars that tested positive and also exhibited a true-positive litter size. The negative predictive value (NPV) is the percentage of boars that tested negative or simultaneously had a true-negative litter size. OA, Overall accuracy. B Western blotting image of HSPD1 and α-tubulin proteins. C Relative expression of HSPD1 in high- and low-litter size groups. The data are expressed as the mean ± SEM; *P < 0.05

