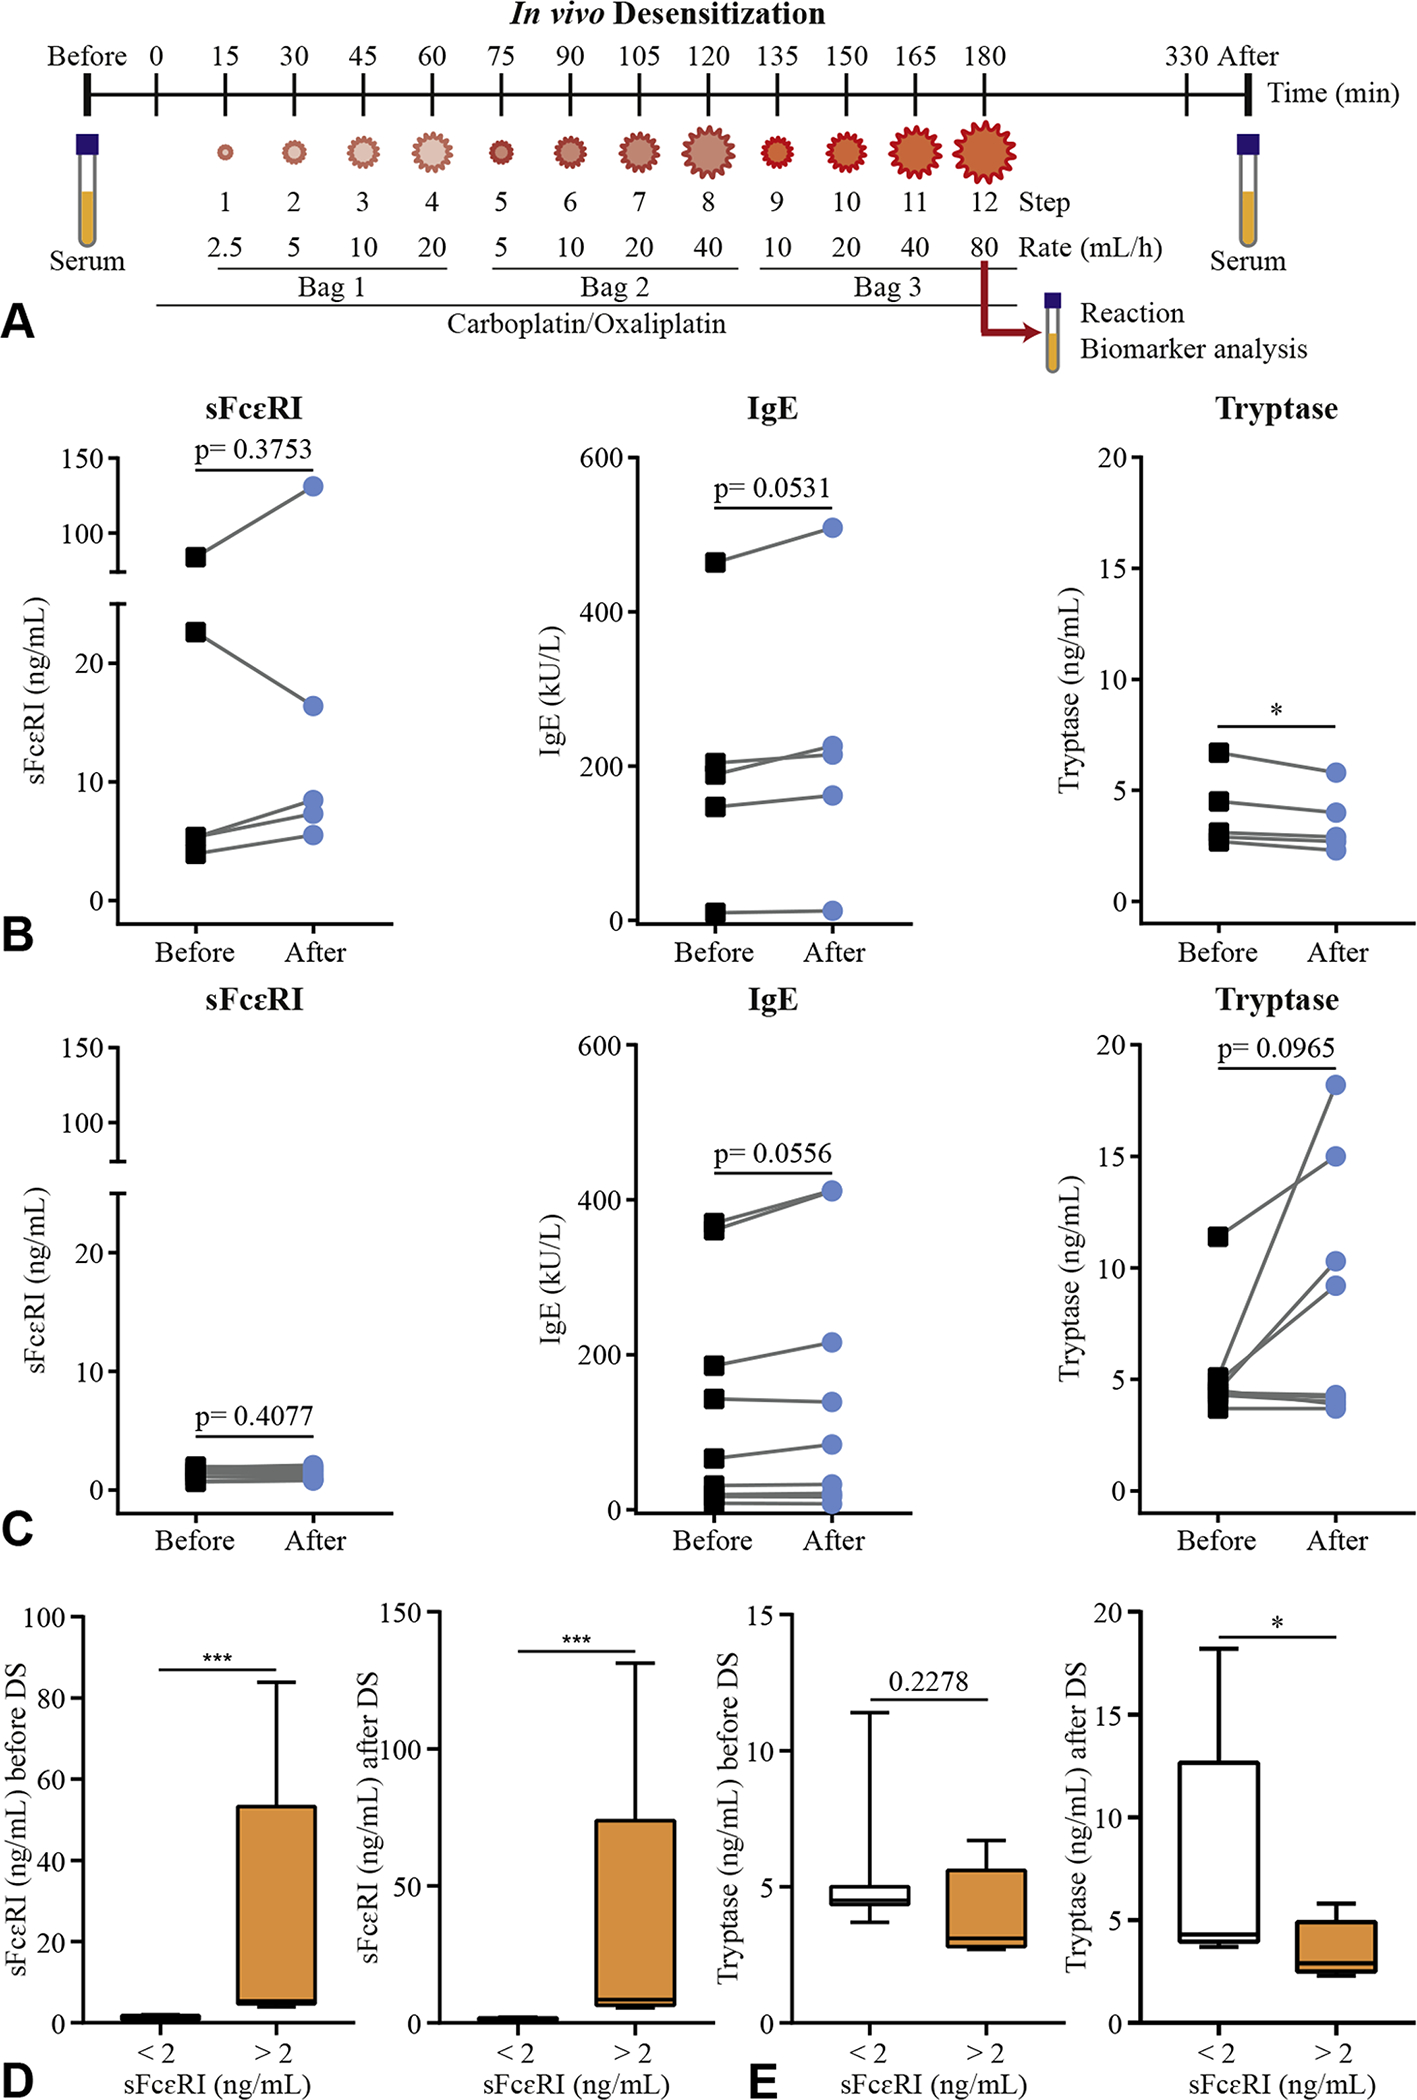
FIGURE 1.

Baseline sFcεRI levels as a biomarker for risk of IgE-mediated reactions during DS. Outline of the in vivo DS protocol of 3 bags/ 12 steps (A). Levels of total sFcεRI, total IgE, and tryptase before (black squares) and after (blue circles) DS. Patients (n = 5) with sFcεRI levels >2 ng/mL (B) and patients (n = 9) with sFcεRI levels <2 ng/mL (C) are represented. Levels of total sFcεRI (D) and tryptase (E) before and after DS. Patients (n = 5) with sFcεRI levels >2 ng/mL (white bar) and patients (n = 9) with sFcεRI levels <2 ng/mL (orange bar) are represented (D) as box and whisker graphs (minimum to maximum). A paired t-test or a Mann-Whitney test was performed, where *P < .05, ***P < .001. DS, Desensitization; sFcεRI, soluble FcεRI.
