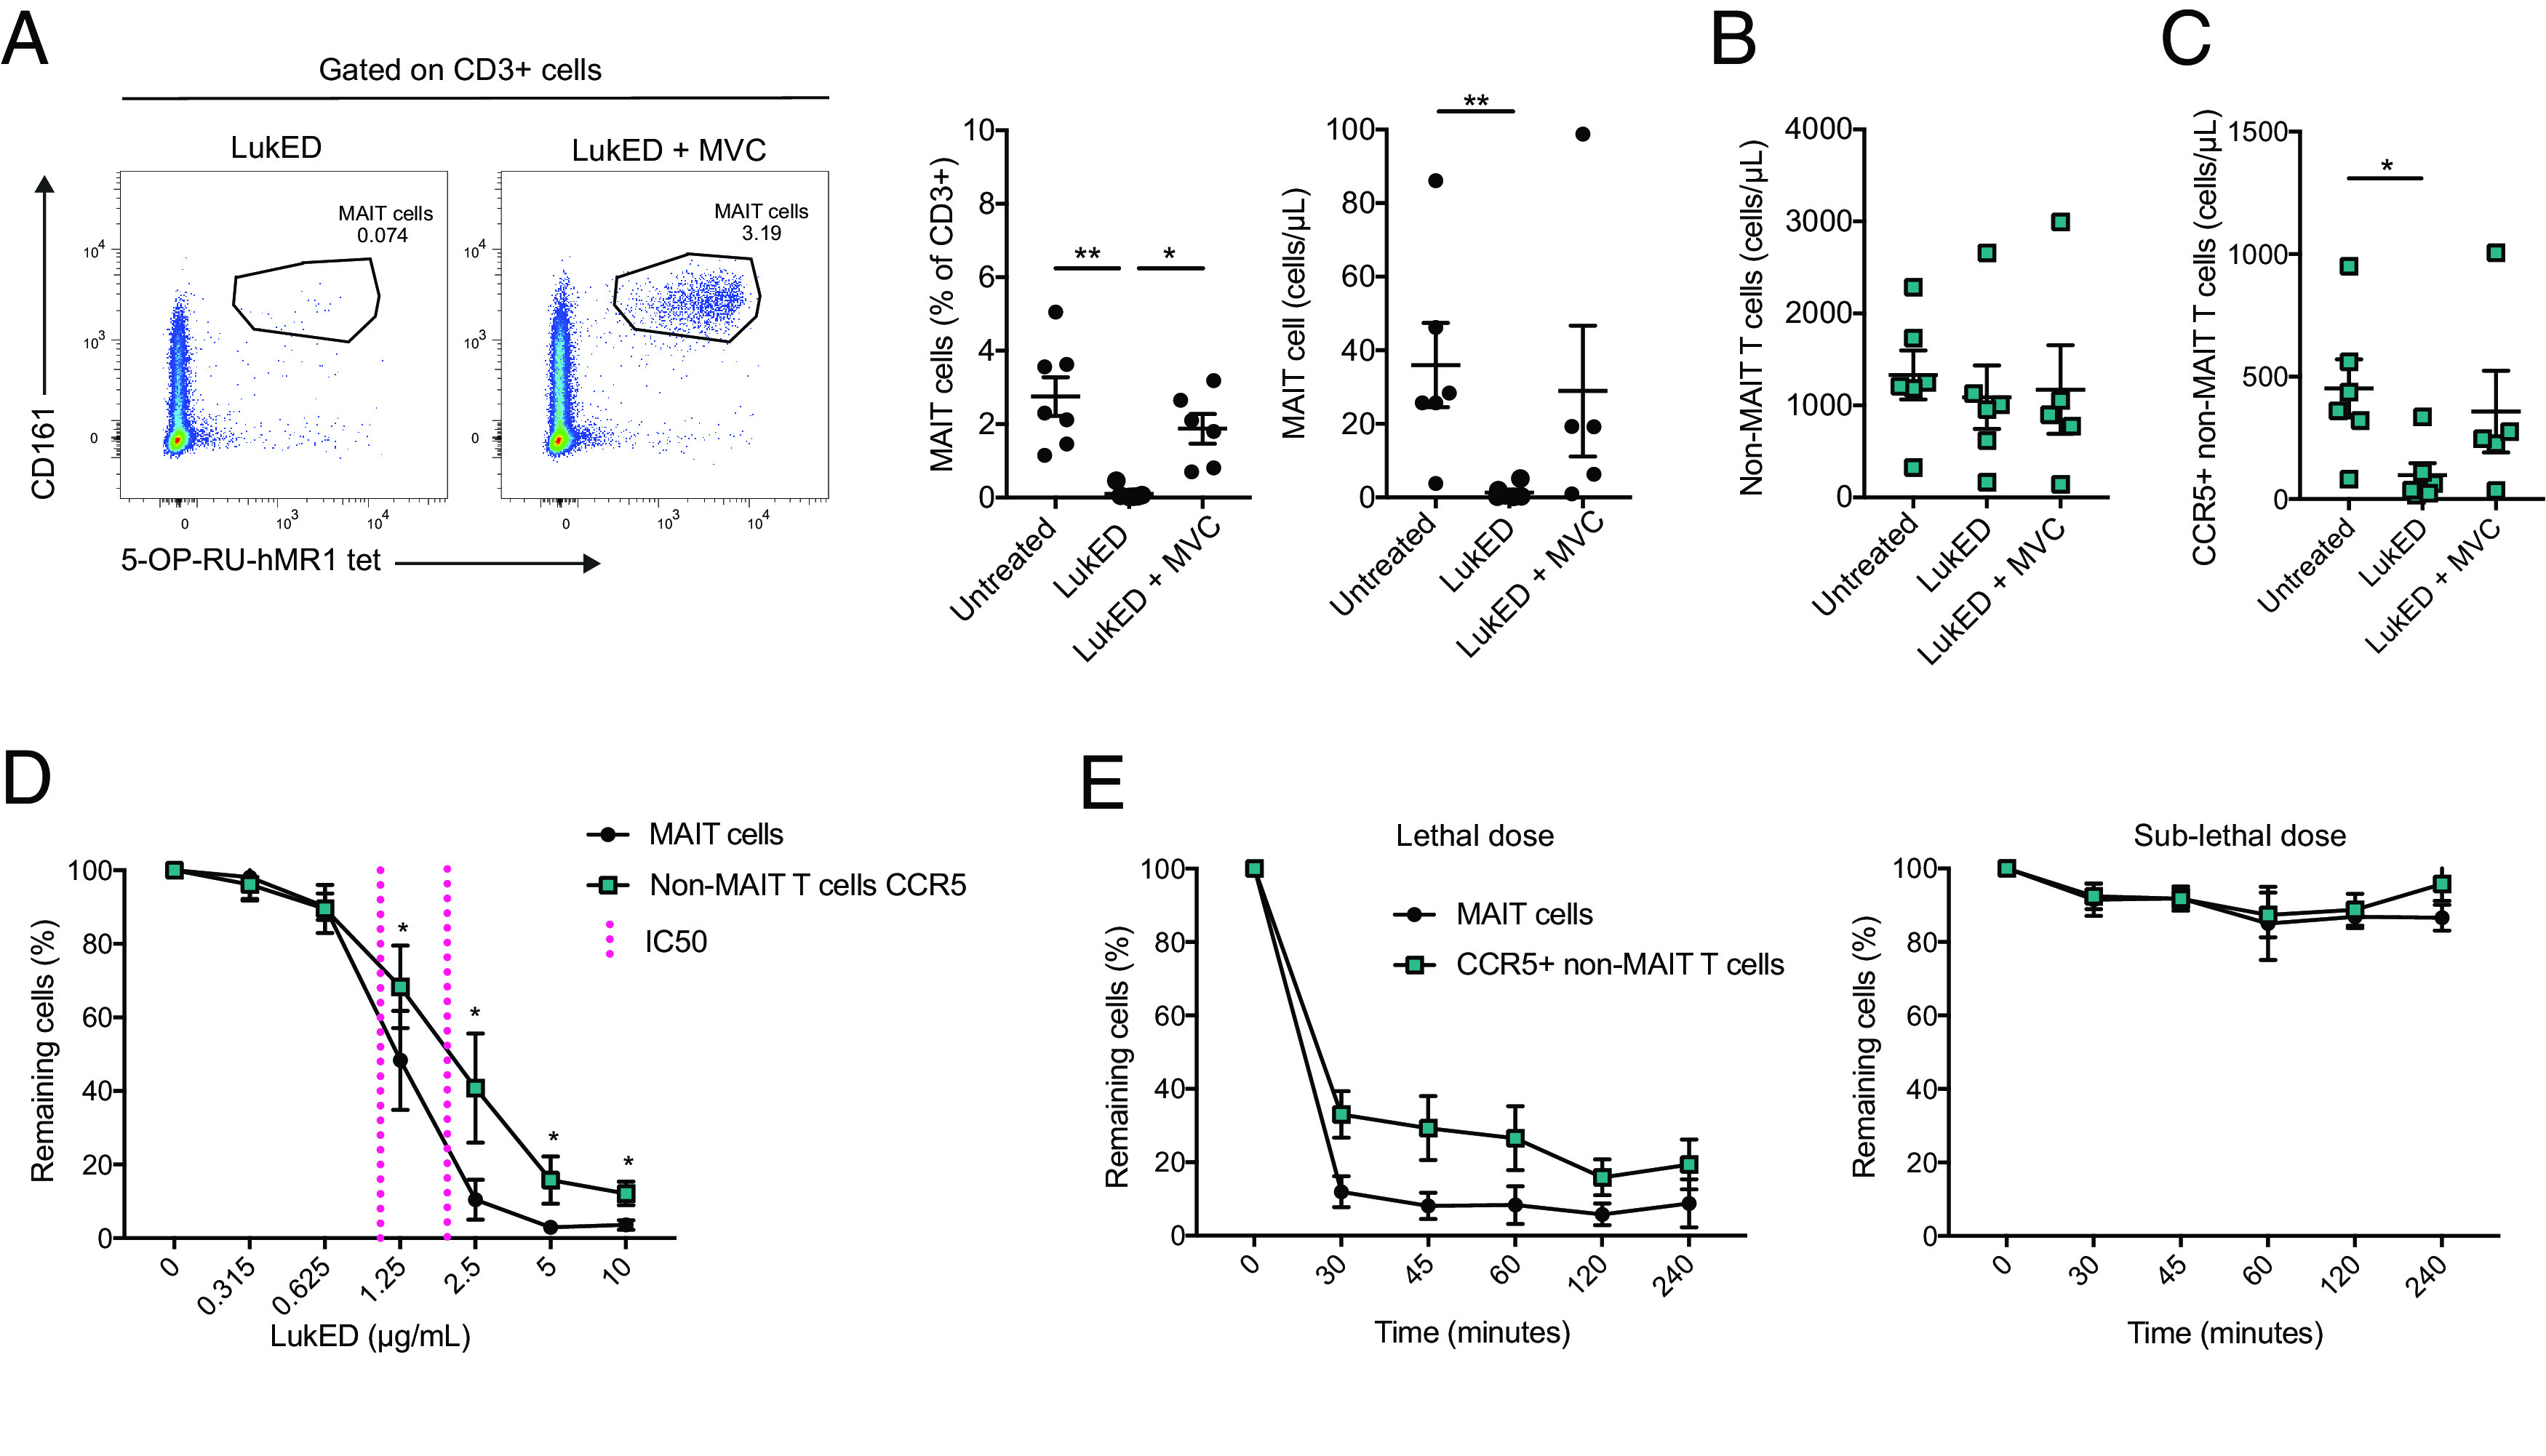
FIGURE 3.

MVC rescues MAIT cells from LukED in vitro. (A) Representative flow cytometry plots, mean percentage, and absolute count of MAIT cells on LukED treatment with or without MVC (n = 6–7). MVC is used at 1 µg/ml. LukED was used at 5 µg/ml for 4 h in (A)–(C). (B) Absolute cell counts of non-MAIT T cells on LukED exposure with or without MVC (n = 5–6). (C) Absolute counts of CCR5+ non-MAIT T cells on LukED exposure with or without MVC (n = 5–6). (D) Relative percentages of MAIT cells and CCR5+ non-MAIT T cells over a range of LukED concentrations after 2 h of exposure. The IC50 is indicated in magenta (n = 6). (E) Relative percentages of MAIT cells and CCR5+ non-MAIT T cells after exposure to a high dose of LukED (5 µg/ml) and low dose of LukED (0.625 µg/ml) during a time course from 30 min to 4 h (n = 6). The Kruskal–Wallis test followed by Dunn post hoc test was used to detect significant differences in (A) and (C). The Wilcoxon signed-rank test was performed to detect significance between the two populations in (D). The lines and error bars represent mean and SE. *p < 0.05, **p < 0.005.
