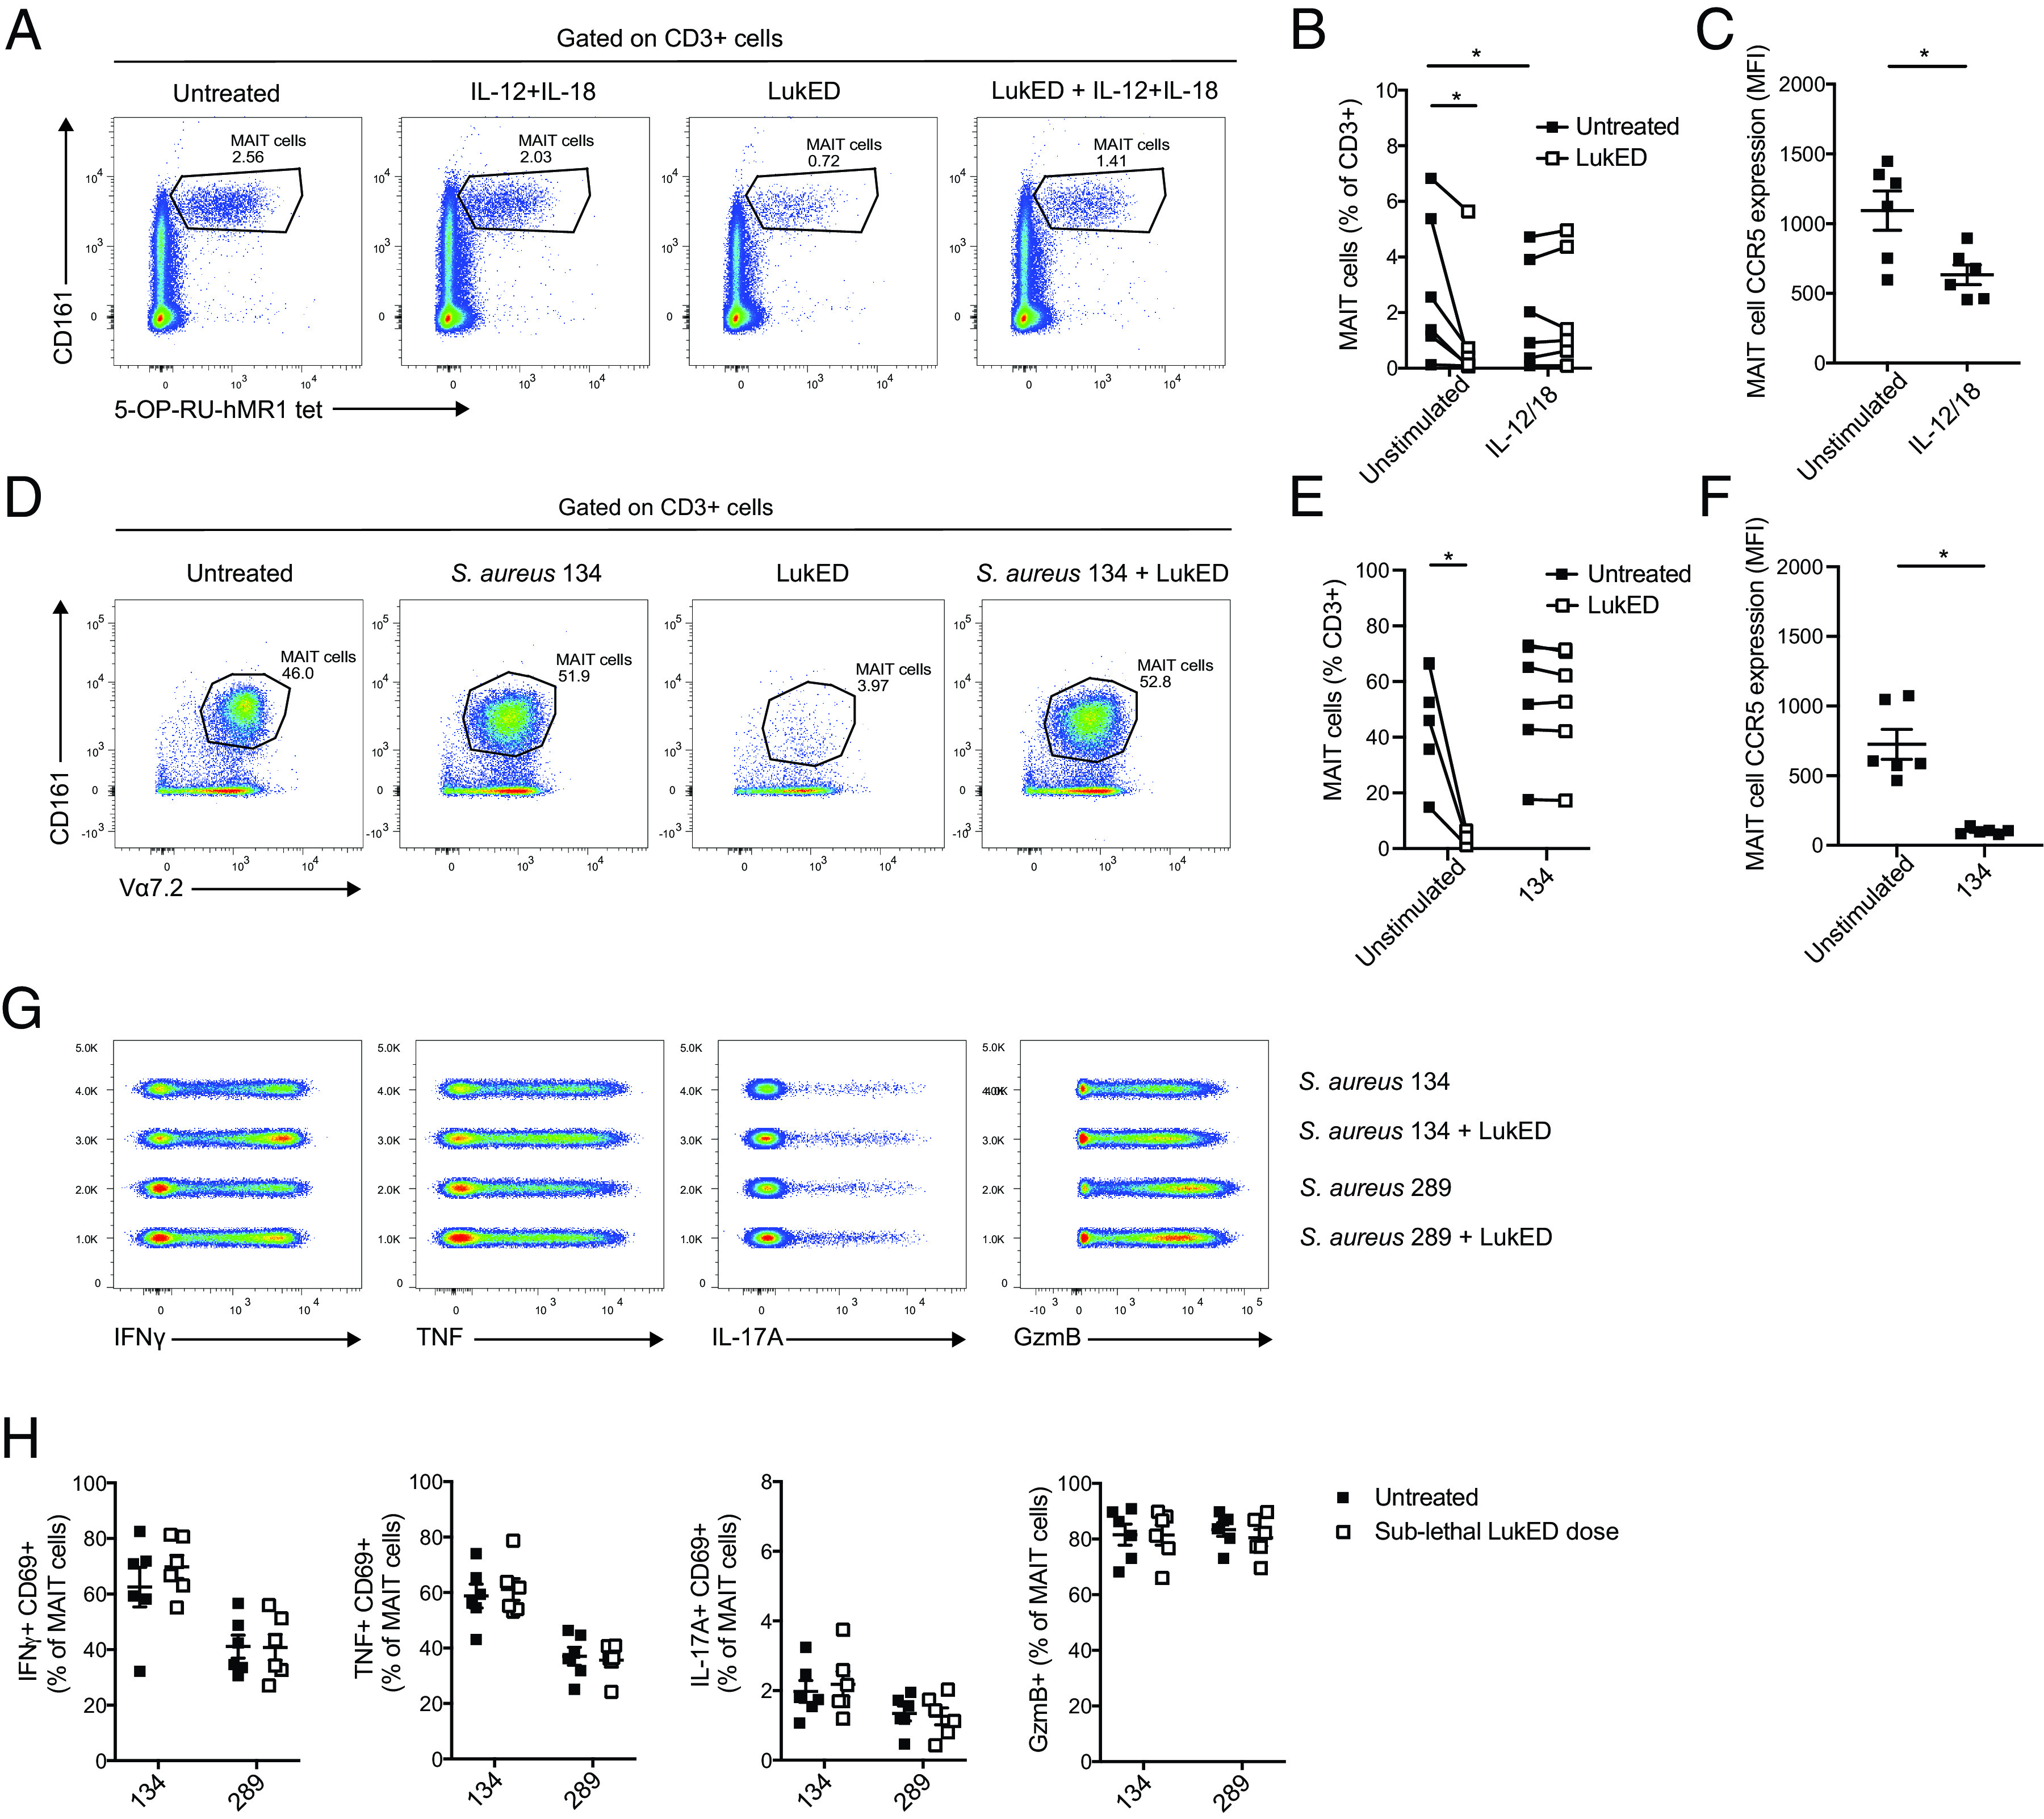
FIGURE 4.

MAIT cell activation with innate cytokines or recognition of bacteria renders them partly resistant to LukED. Representative flow cytometry plots (A) and levels (B) of MAIT cells after 20-h stimulation with IL-12 and IL-18, in the presence or absence of LukED at 1.25 µg/ml during the last 2 h of stimulation (n = 6). (C) CCR5 expression on MAIT cells stimulated 18 h with IL-12 and IL-18 (n = 6). Representative flow cytometry plots (D) and percentage (E) of MAIT cells after 24-h stimulation with S. aureus strain 134 at MOI 30, in the presence of LukED at 5 µg/ml during the last 6 h of incubation (n = 6). (F) CCR5 expression on MAIT cells stimulated for 24 h with S. aureus 134 (n = 6). Concatenated flow cytometry plots (G) and combined data (H) of the expression of IFN-γ+CD69+, TNF+CD69+, IL-17A+CD69+, and GzmB+ MAIT cells untreated or stimulated with THP-1–fed S. aureus 134 (LukED negative) or 289 (LukED positive) for 24 h at the microbial dose of 30, after exposure to a sublethal dose of LukED (0.312 µg/ml). The Wilcoxon signed-rank test in (B), (C), and (F) and the Mann–Whitney U test in (E) were performed to detect significance. The lines and error bars represent mean and SE. *p < 0.05.
