FIGURE 4.

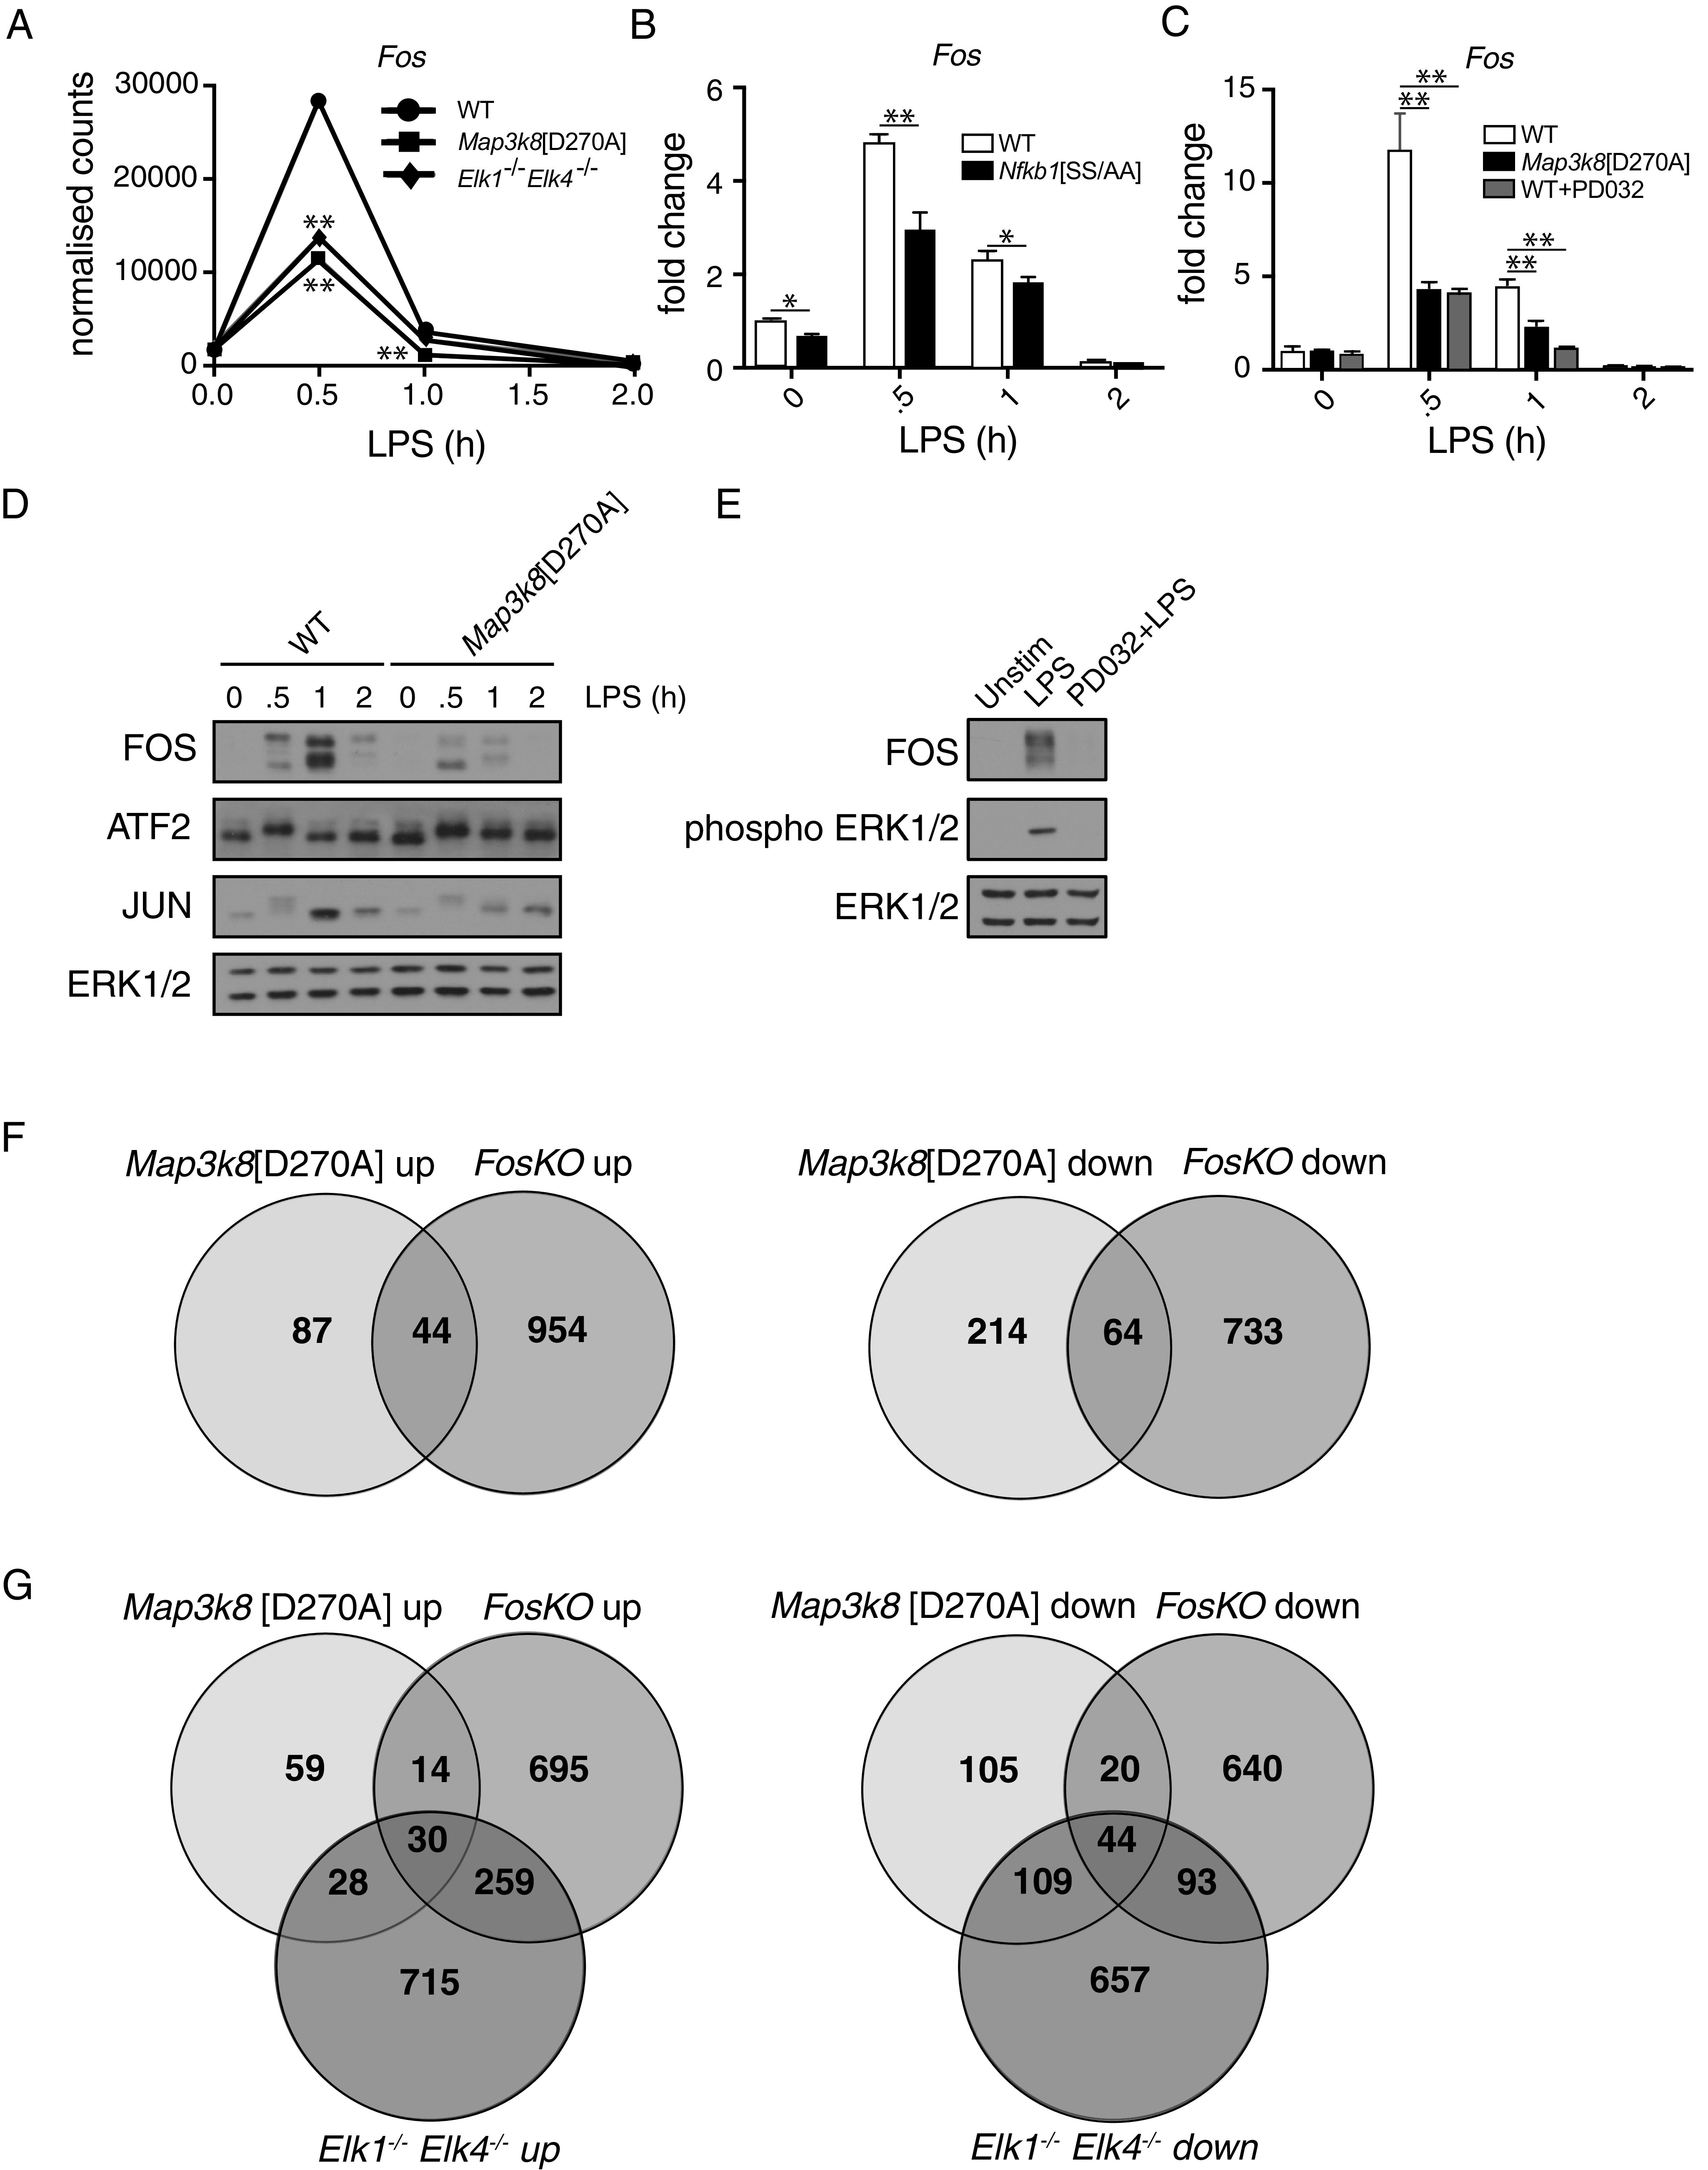
TPL-2 controls LPS-induced gene expression via regulation of FOS abundance. (A) Normalized counts for Fos from the RNA-seq analyses of WT, Map3k8[D270A], and Elk1−/−Elk4−/− BMDMs stimulated with LPS for indicated times. *p ≤ 0.01. (B) WT and Nfkb1[SS/AA] BMDMs were stimulated with LPS during a 2-h time course. *p ≤ 0.01, **p ≤ 0.01. (C) WT BMDMs with and without PD0325901 and Map3k8[D270A] BMDMs were stimulated with LPS for the indicated times. In (B) and (C), Fos mRNA expression was analyzed by qRT-PCR. Results are representative of three similar experiments. **p ≤ 0.01. (D) WT and Map3k8[D270A] BMDMs were stimulated with LPS for indicated times. Total cell lysates were immunoblotted for antigens shown. (E) WT BMDMs with and without PD0325901 were stimulated with LPS for 30 min. Total cell lysates were immunoblotted for antigens shown. Results in (D) and (E) are representative of three similar experiments. (F) Venn diagrams to overlaps of genes upregulated or downregulated (>2-fold) by Map3k8[D270A] mutation and FOS deficiency, calculated from Map3k8[D270A]/WT and FosKO/LysM-Cre RNA-seq comparisons. (G) Venn diagram comparison of TPL-2-, TCF-, and FOS-regulated genes identified in RNA-seq experiments. Overlap of genes upregulated or downregulated by Map3k8D270A mutation, TCF deficiency, and FOS deficiency.
