Figure.
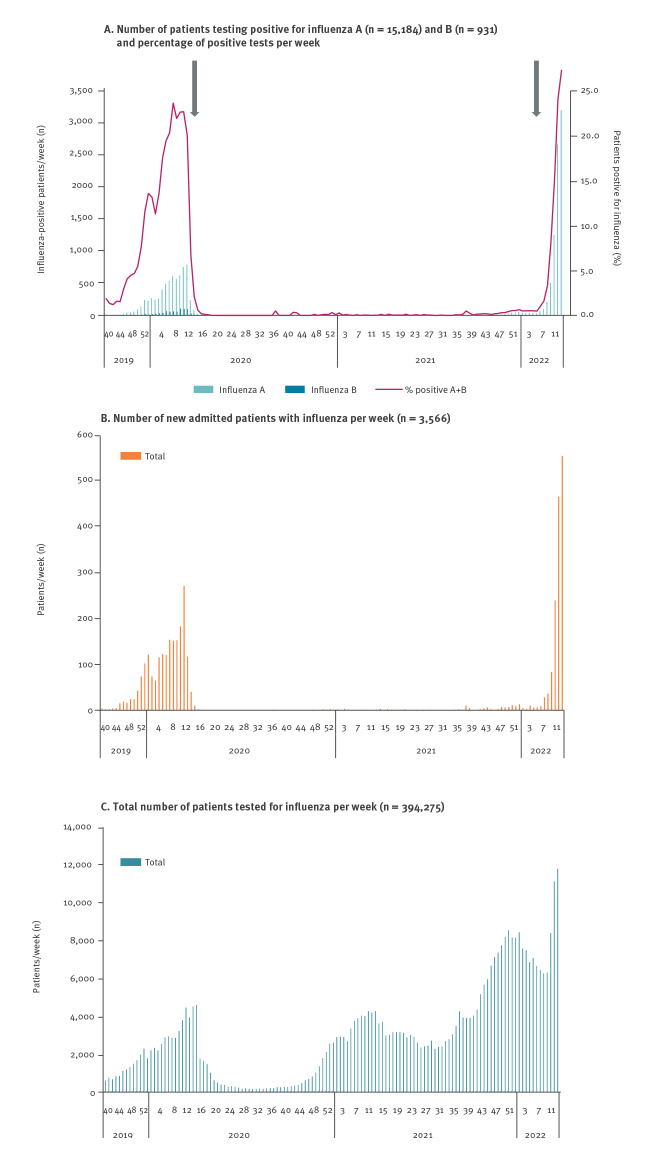
A. Number of patients testing positive for influenza A and B and percentage positive tests, B. number of new patients admitted to hospital with influenza and C. total number of patients tested for influenza by week, Denmark, week 40 2019–week 12 2022
In panel A, the grey arrows indicated points in time for implementation (left arrow) and lift (right arrow) of coronavirus disease (COVID-19) restrictions.

