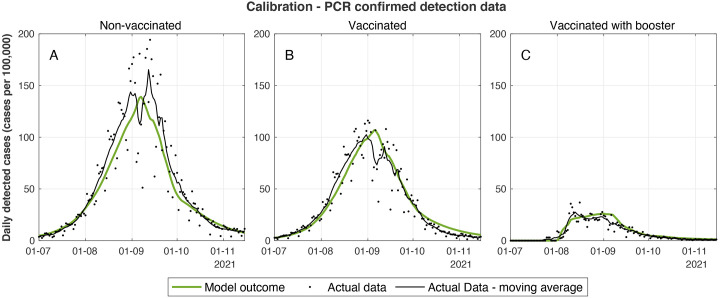
Fig. 1.
Calibrated model outcomes vs actual case data. (A-C) Daily number of new detected cases per 100,000 people who were not vaccinated (A), who received two vaccine doses (B), and who received three vaccine doses (C) showing both seven-day moving average of observed data (black markers) and model outcome (green curves). The data series presented in these graphs are aggregated from 27 data series that were used for model calibration. Graphs corresponding to each of the data series are presented in the supplementary materials.

