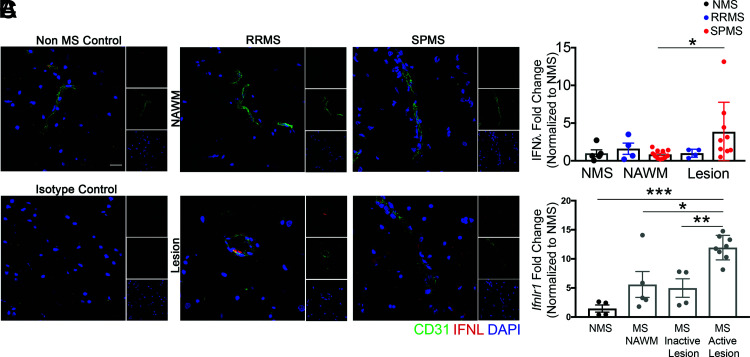
FIGURE 7.
IFNL and IFNLR1 expression are increased in MS lesions. (A) Postmortem tissue specimens were analyzed: n = 5 samples from 5 non-MS (NMS) controls, n = 4 lesion samples and n = 4 NAWM samples from 3 RRMS patients, and n = 9 lesion samples and n = 11 NAWM samples from 7 SPMS patients (Table I). Samples from patients without MS were obtained from cortical white matter, whereas samples from patients with MS were obtained from multiple CNS regions, including the cortex, putamen, periventricular white matter, and midbrain. Perivascular and parenchymal localization of IFNL in NAWM and in lesions were visualized using IF for CD31 and IFNL. Nuclei were counterstained with DAPI. Scale bar, 20 μm. (B) Area of IFNL was quantified. All values were normalized to the average of the NMS samples; each data point represents one tissue sample. (C) RNA was analyzed from postmortem human specimens: n = 4 samples from 3 NMS controls and n = 5 NAWM samples, n = 4 inactive lesion samples, and n = 8 active lesion samples from 18 patients with MS (Table II). Relative Ifnlr1 mRNA expression was measured by qRT-PCR. All values were normalized to the average of the NMS samples; each data point represents one tissue sample. Data are presented as means ± SEM. *p < 0.05, **p < 0.01, ***p < 0.001 by one-way ANOVA with multiple comparisons (B and C).

