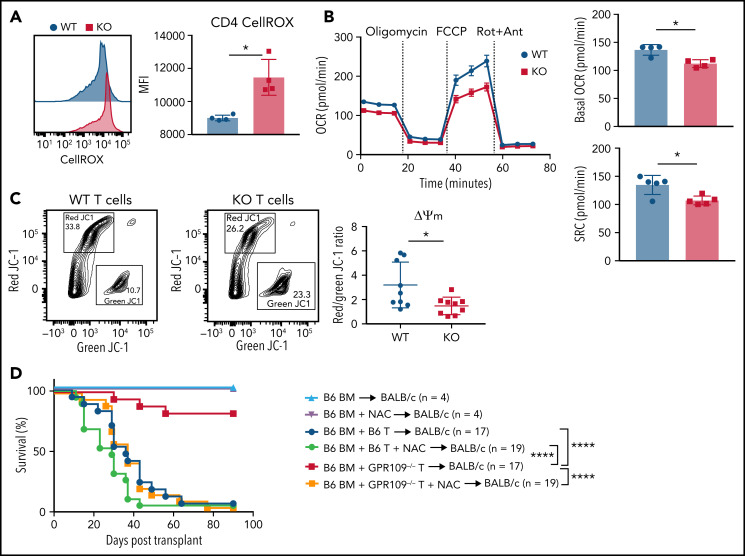
Figure 6.
GPR109A−/− T cells become metabolically dysfunctional after activation. (A) MFI of CellROX green in WT and KO T cells on day 3 post allo-HCT. (B) OCR of in vitro activated WT (black) or KO (red) T cells, as measured under basal conditions and in response to oligomycin, FCCP, and Rot + Ant and spare respiratory capacity of WT and KO T cells. (C) Representative flow cytometric analysis of green vs. red JC-1 aggregates of in vitro activated WT and KO purified T cells without (blue) and with (green) N-acetylcysteine (NAC) in the drinking water, or WT BM with KO T cells without (red) and with (orange) NAC in the drinking water. Controls were transplanted with T cell-depleted BM only without (light blue) and with NAC (purple) in the drinking water. Comparisons in (H) were performed by Mantel-Cox log rank test for survival. All comparisons in (A) to (C) were performed by two-tailed unpaired Mann-Whitney Test. Values are means ± standard deviation. *P < .05, ****P < .0001, n = 4-9 mice per group, or as indicated. All results from two independent experiments.

