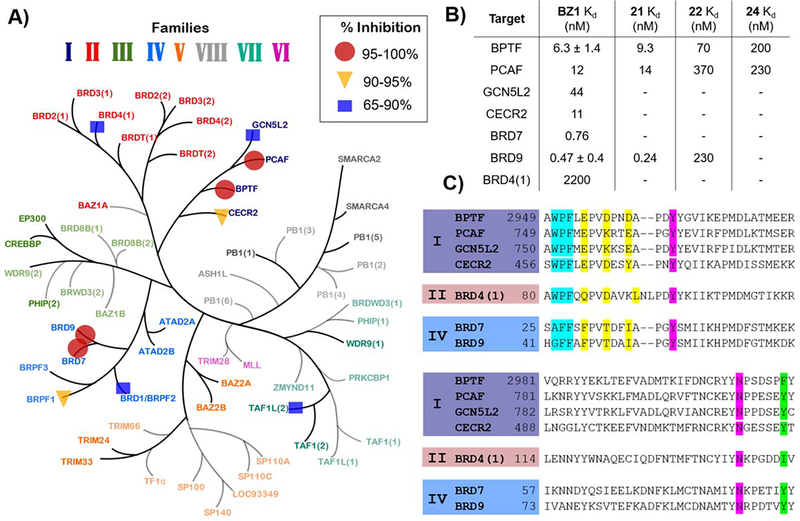
Figure 5.
A) Single-point measurement of 140 nM BZ1 against a representative panel of 32 bromodomains via BROMOscan. Percent inhibition ranges are shown by: circles 95–100%, triangles 90–95% and squares 65–90%. (Adapted with permission from Pomerantz et al.)11. B) Kd values for BZ1 with BPTF and off-target class I (PCAF, GCN5L2, CECR2,) and class IV (BRD7, BRD9) bromodomains and BRD4(1) as the highest off-target from the BET family and Kd values for compound 21, 22 and 24 with BPTF, PCAF and BRD9. Values are averages of two technical replicates, N = 1, except BZ1 with BPTF and BRD9, which are averages of two experimental replicates. C) Sequence alignment of selected bromodomains highlighting WPF shelf motif (cyan), 3D equivalents of acidic triad (yellow), Kac mimetic H-bonding groups (magenta), and the gatekeeper residue (green).

