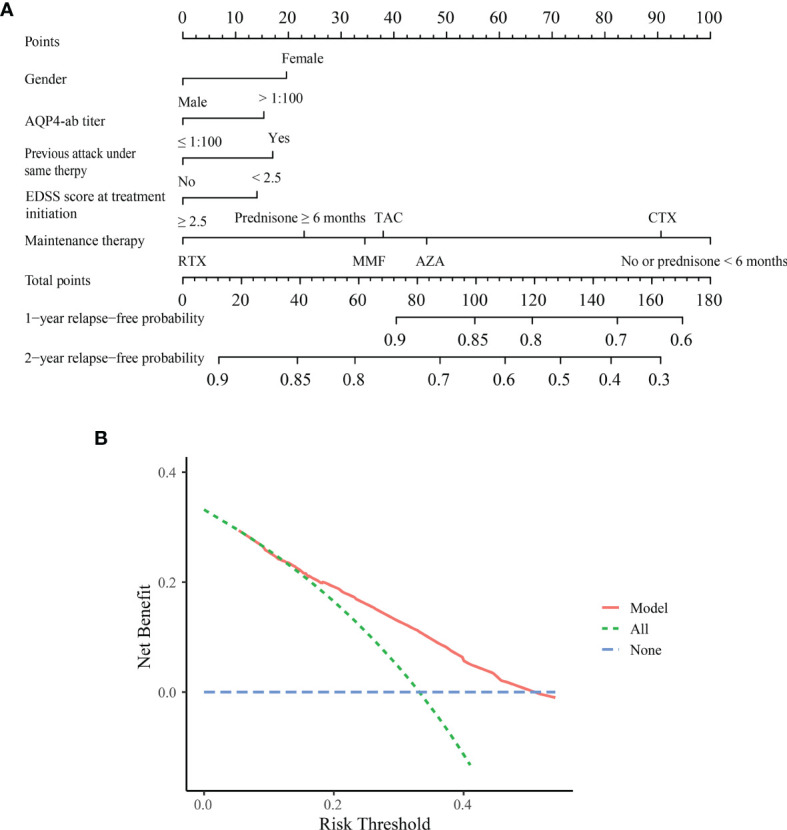
Figure 2.

Nomogram and decision curve analysis in the primary cohort. (A) Nomogram for predicting 1- and 2-year relapse-free probability in the primary cohort. Based on each variable axis of the nomogram, the probability for each patient was determined (upward-pointing line). At the total-points axis, the sum of points corresponds to 1- and 2-year relapse-free probability (downward-pointing line). (B) Decision curve analysis for the Model. The decision curve revealed that if the threshold probability exceeds 0.15, this nomogram was superior for predicting subsequent relapses compared to either treat-all or treat-none scheme. ON, optic neuritis; TM, transverse myelitis; EDSS, Expanded Disability Status Scale; AZA, azathioprine; MMF, mycophenolate mofetil; TAC, tacrolimus; RTX, rituximab; CTX, cyclophosphamide.
