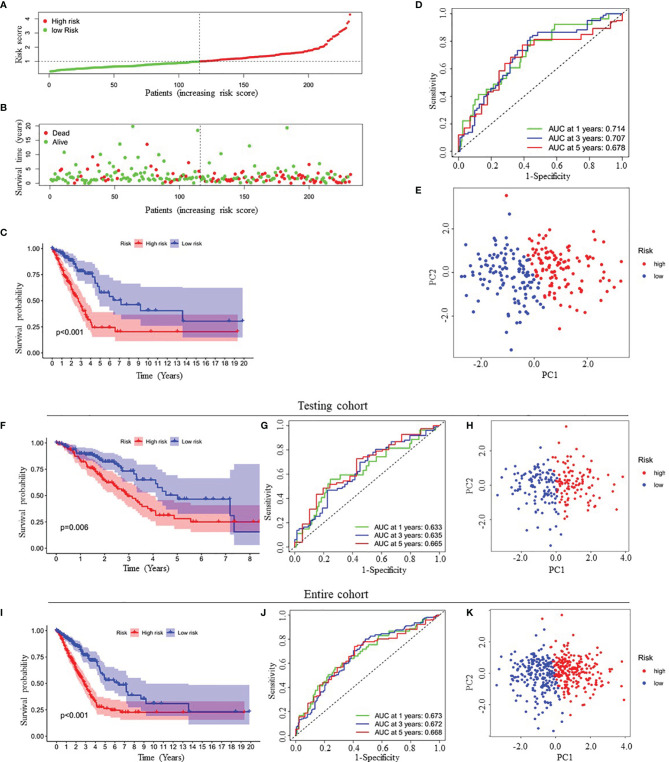
Figure 2.
Prognostic analysis of four-gene signature in the training cohort, testing cohort and entire cohort. (A, B) The distribution of risk score (A) and patient’s survival time (B) in the training cohort. (C, F, I) Kaplan-Meier survival analysis of the four-gene signature in the training cohort (C), testing cohort (F) and entire cohort (I), respectively. (D, G, J) Time-dependent ROC analysis of the four-gene signature in the training cohort (D), testing cohort (G) and entire cohort (J), respectively. (E, H, K) Principal components analysis (PCA) of whole gene expression data between low- and high-risk groups in the training cohort (E), testing cohort (H) and entire cohort (K), respectively. ROC, receive operating characteristic; AUC, area under curve.

