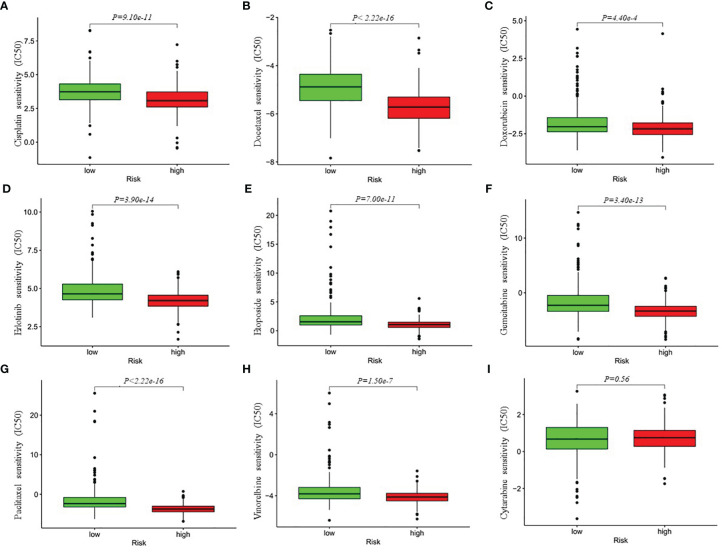
Figure 7.
Differential chemotherapeutic responses in low- and high-risk LUAD patients (A–I). The IC50 values of the high- and low-risk groups were calculated based on the GDSC (Genomics of Drug Sensitivity in Cancer) data (https://www.cancerrxgene.org/). IC50, half maximal inhibitory concentration.

