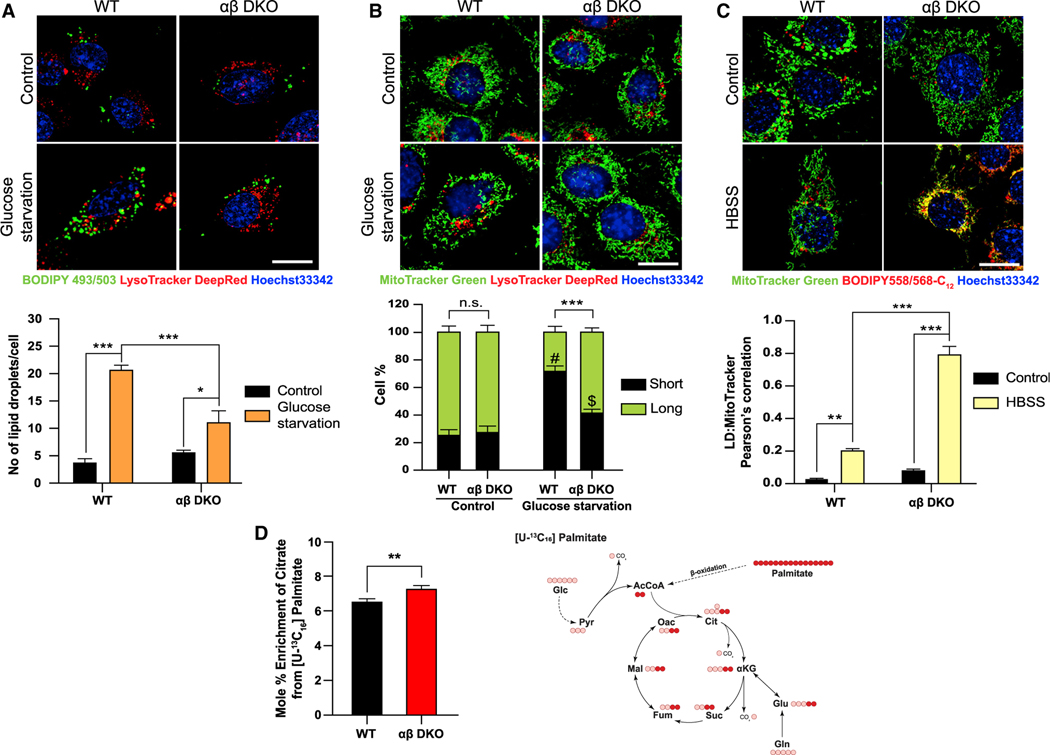
Figure 3. Mitochondria exhibit increased lipid uptake and β-oxidation upon loss of PI5P4Ks.
(A) WT and αβ DKO MEFs were plated and then grown under control or glucose starved conditions for 16 h followed by staining (A) BODIPY FL (green; LDs), LysoTracker Deep Red (red; lysosomes) and Hoechst 33342 (blue; nucleus) (top) and graph showing number of LDs/per cell (bottom).
(B) MitoTracker Green (mitochondria), LysoTracker Deep Red (lysosomes) and Hoechst 33342 (blue; nucleus) (top) and graph showing quantification of percent of short and long fragments of mitochondria per cell (bottom).
(C) MEFs were pulsed with Red-C12 (lipid) overnight and then chased in control medium or HBSS for 16 h. Cells were stained with MitoTracker Green (mitochondria) and Hoechst 33342 (blue; nucleus) for 30 min (top) and graph showing the quantification of colocalization of LDs into the mitochondria as a measure of uptake (bottom). Live cell imaging for (A–C) was done using 63× oil on Zeiss LSM710. Scale bar, 10 μm.
(D) Tracer map showing accumulation of carbons from labeled palmitate in various metabolites (right) and percent citrate enrichment from [U-13C16] palmitate tracing in MEFs (left). Statistical analysis: n = 3, mean ± SD. A two-way ANOVA was performed, and Tukey’s method was used to correct for multiple comparisons for (A–C). # indicates p < 0.001; *** and $ indicate p < 0.01; ** compared with their respective control medium. A paired two-tailed t test was used for (D). For imaging experiments ≥ 30 cells were examined per experiment.

