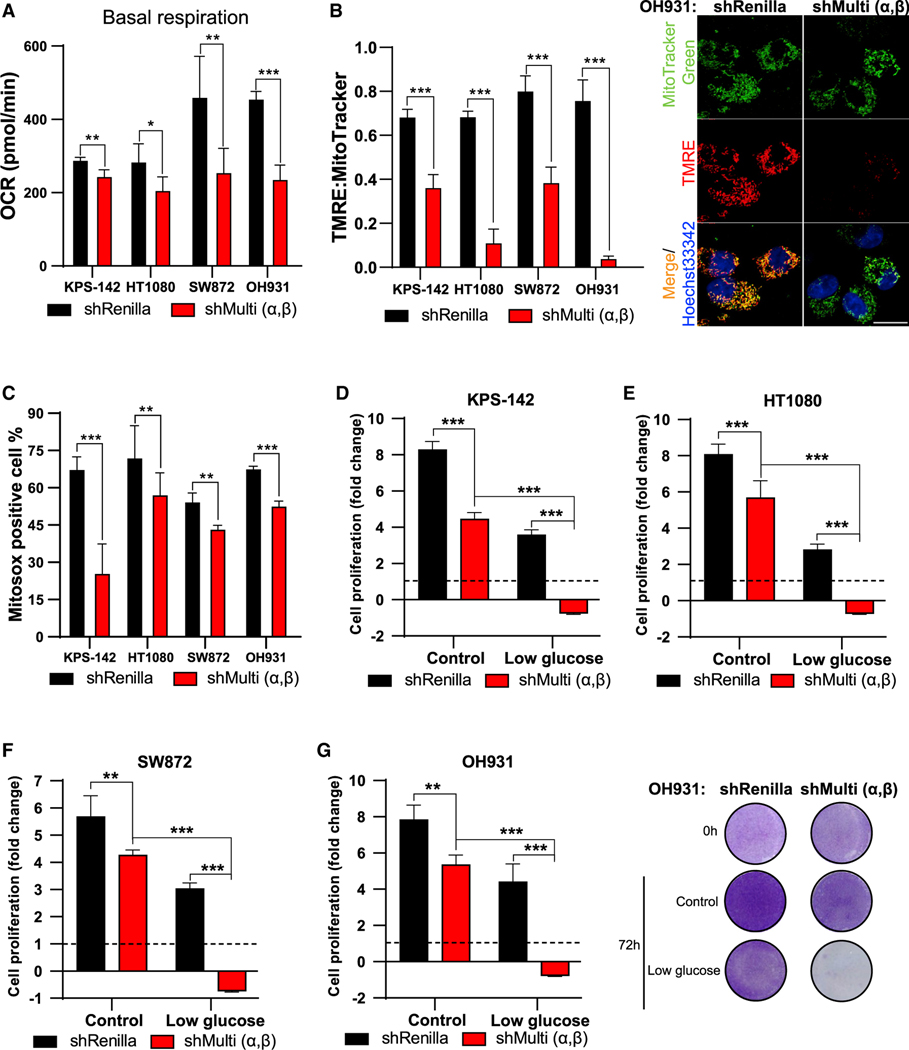
Figure 5. Silencing of PI5P4Ks affects mitochondrial function in cancer cells.
For all experiments, the shRenilla and shMulti (α,β) lines, KPS-142, HT1080, SW872, and OH931 were treated with 1 μg/mL dox for 14 days prior to the experiment.
(A) Basal respiration rate as measure by Seahorse Xfe24 analyzer and normalized to protein concentrations. Data are presented as a mean ± SD of n = 3 wells.
(B) Quantification of the fluorescent density ratio of TMRE:MitoTracker Green. Mitochondrial membrane potential in OH931 cells as visualized by accumulation of TMRE (red) in the MitoTracker Green (mitochondria) and Hoechst 33342 (nucleus). Live cell imaging was done using 63× oil on Zeiss LSM710. Scale bar, 10 mm.
(C) Quantification of fluorescence intensity of MitoSOX analyzed by flow cytometry. Cell proliferation measured at 72 h by crystal violet in control medium and upon low glucose (1%) in the (D–F) (D) KPS-142, (E) HT1080, (F) SW872, and (G) OH931 cell lines (left) and representative image of crystal violet accumulation in the OH931 cells under the different treatments. Statistical analysis: n = 4, mean ± SD. A two-way ANOVA was performed, and Tukey’s method was used to correct for multiple comparisons for (D–G). A paired two-tailed t test was used for (A–C).

